Predictive Deviation Intelligence: How AI Agents Eliminate Repeat Quality Failures
Your quality team investigates 200+ deviations per month. The same root causes keep recurring. The same investigations keep being repeated. What if the system could predict the next deviation — and prevent it?
Key Takeaways
70% of pharmaceutical deviations share root causes with previous batches, yet current QMS platforms investigate each one independently — consuming 60-70% of quality team time on documentation rather than improvement, at $10,000-$30,000 per investigation.
FDA enforcement data shows the consequences of this approach: documentation-related 483 observations have increased 38% year-over-year, and cases like Bristol-Myers Squibb's 337 deviations with zero root cause investigations demonstrate how reactive systems fail at scale.
Predictive deviation intelligence uses AI agents that build a causal knowledge graph across all historical deviations — detecting cross-batch patterns, correlating environmental and equipment signals, and identifying failure precursors before the next deviation occurs.
Implementation follows three phases: digitise and classify existing deviation records (Assess), deploy cross-batch pattern recognition and correlation agents (Predict), and enable real-time risk scoring with automated preventive actions (Prevent).
In May 2023, the FDA issued a Form 483 to Bristol-Myers Squibb citing 337 deviations recorded over a six-month period — with zero root cause investigations completed. The observation was not about individual deviations. It was about a systemic inability to learn from them. Every deviation was logged. None were connected. The same failure modes recurred because the quality management system treated each event as independent, even when the underlying causes were shared across batches, equipment, and processes.
This is not an isolated failure. It is the default operating mode of pharmaceutical quality management. The industry’s approach to deviation management was designed for a world of paper records and single-facility operations — investigate each event, document the finding, close the record. That approach cannot scale to modern multi-site manufacturing where a single quality team manages 200+ deviations per month across dozens of product lines and hundreds of pieces of equipment. The result is a system that generates investigations faster than it generates insight.
This whitepaper examines why the current deviation management paradigm is structurally incapable of preventing repeat failures, how predictive deviation intelligence — built on AI agents that construct and reason across a causal knowledge graph — changes the dynamic from reactive investigation to proactive prevention, and what the practical implementation path looks like for organisations ready to make the shift.
The quality management problem is not that deviations go uninvestigated. It is that each investigation starts from zero — as if the organisation has no memory of every previous deviation it has ever resolved.
The Deviation Trap
Why quality teams are drowning in investigations that never compound into prevention
The economics of deviation management in pharmaceutical manufacturing are unsustainable. At $10,000-$30,000 per investigation (PDA/ISPE benchmarks), a facility processing 200+ deviations per month faces annual investigation costs in the millions — before accounting for the opportunity cost of quality professionals spending 60-70% of their time on documentation rather than root cause analysis and process improvement.
The deeper problem is not cost but compounding inefficiency. Because each deviation is investigated independently, the same root causes are rediscovered repeatedly. Operator training gets cited as a CAPA for equipment-related failures. Environmental excursions get attributed to seasonal variation without checking whether the HVAC system was serviced. The investigations produce records, not knowledge.
200+
Deviations per month
Average at a mid-to-large pharmaceutical manufacturing site, across production, QC, and utilities
15-30 days
Average closure time
Per deviation investigation, involving multiple departments and review cycles before final disposition
60-70%
Quality team time on documentation
Spent writing, reviewing, and routing investigation reports — not on root cause analysis or process improvement
The Root Cause Repetition Problem
Why 70% of deviations share causes the system cannot see
The fundamental limitation of current quality management systems is architectural, not procedural. Traditional QMS platforms store deviations as discrete records — each with its own investigation, root cause assignment, and CAPA. There is no mechanism to automatically detect that the compression force deviation in Batch 4821 shares the same underlying equipment calibration drift that caused failures in Batches 4793, 4807, and 4815.
This structural blindness manifests in four specific ways that compound over time.
Single-batch investigation scope
Each deviation is investigated within its own batch context. The investigator reviews the batch record, checks in-process parameters, and assigns a root cause. They rarely — and cannot be expected to — manually search 500 previous deviation records to check whether the same cause has appeared before, or whether the current event is part of an emerging cluster.
Free-text root cause assignments
Root causes are typically documented in free-text fields with inconsistent taxonomies. 'Operator error', 'training gap', 'procedural deviation', and 'SOP non-compliance' may all describe the same underlying cause. Without structured classification, pattern detection across investigations is impossible — even for a human analyst reviewing the data manually.
Disconnected data sources
The data needed to identify cross-batch patterns lives in separate systems: MES batch records, environmental monitoring databases, equipment maintenance logs, LIMS results, and material management systems. A deviation in tablet hardness may correlate with a humidity excursion logged in the EMS and an API lot change recorded in the material system — but the QMS sees none of this context.
CAPA effectiveness is assumed, not measured
Once a CAPA is implemented and verified, it is marked complete. Whether it actually prevented recurrence is rarely tracked systematically. A CAPA that mandates retraining on a procedure does not trigger a check six months later to determine whether the same deviation type has reappeared — on the same line, with different operators, suggesting the root cause was never the training.
The industry does not have a deviation detection problem. It has a deviation memory problem. Every investigation that closes without connecting to the broader pattern is institutional knowledge that never forms.
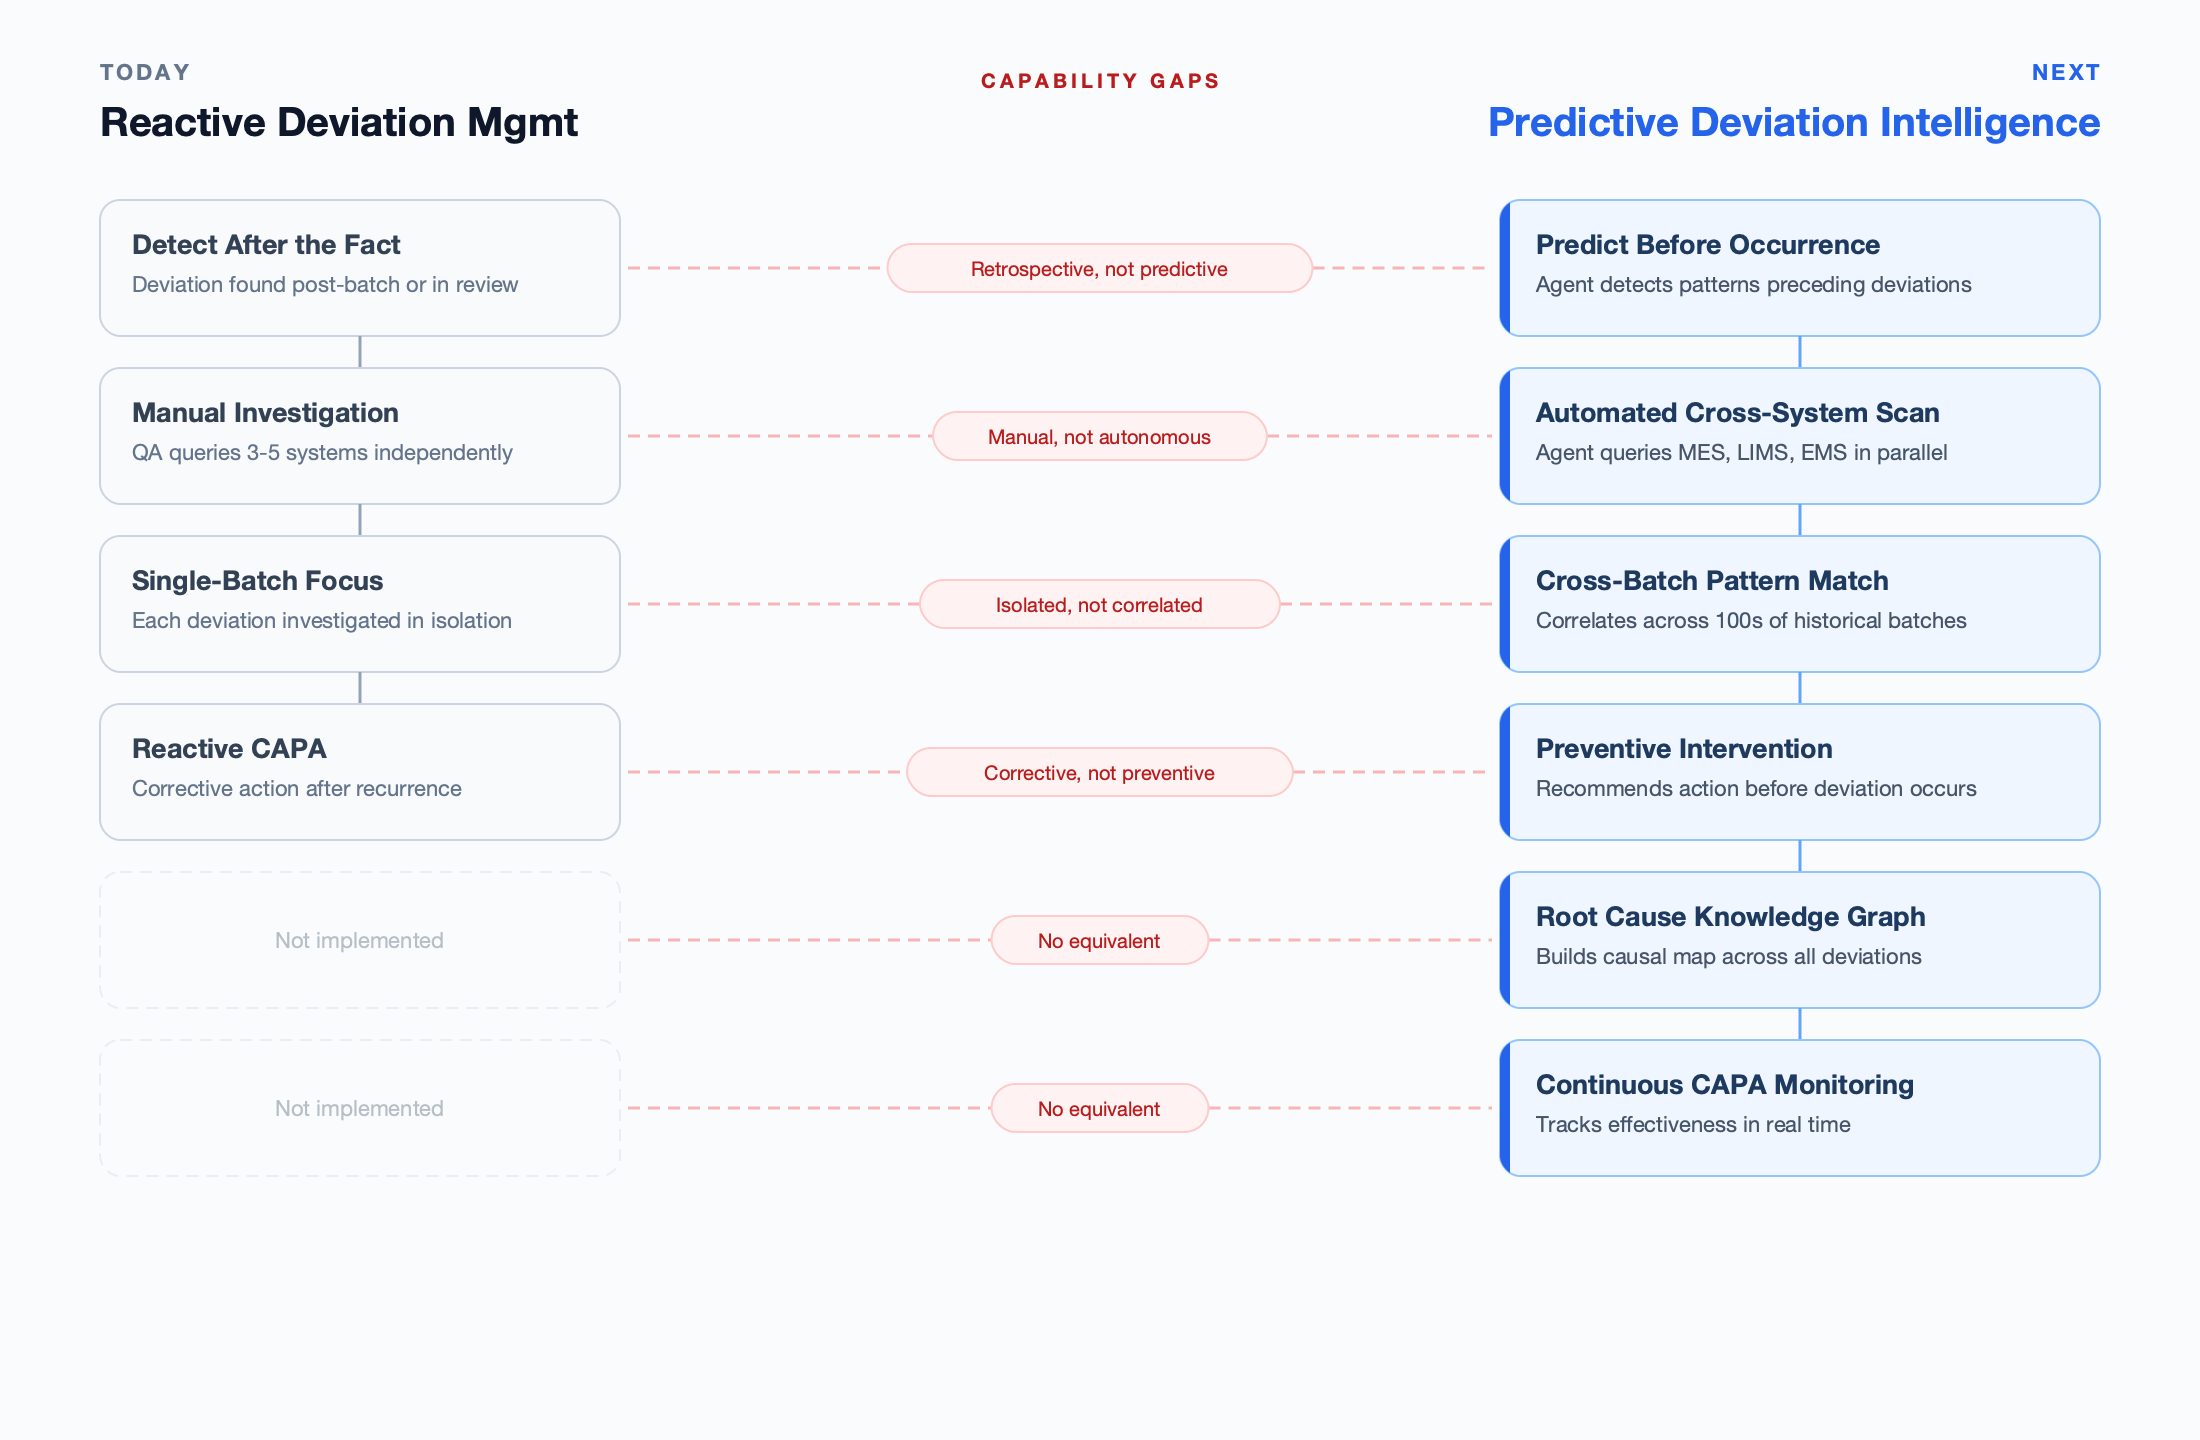
From Reactive to Predictive: A New Architecture for Deviation Intelligence
How agentic AI changes the deviation management paradigm
The technology response to deviation management has progressed through three distinct levels — each representing a fundamentally different architecture, not merely an incremental improvement. Understanding where your current system sits on this spectrum determines whether you are managing deviations or preventing them.
Most pharmaceutical manufacturers today operate at Level 1. A growing number have adopted Level 2 copilot tools. Level 3 — agentic deviation intelligence — requires a different architectural foundation entirely.
Three levels of deviation intelligence — reactive QMS vs. AI copilot vs. agentic system
| Dimension | Reactive QMS | AI Copilot | Agentic Deviation Intelligence |
|---|---|---|---|
| Detection | Manual observation; deviation logged after the event occurs | Suggests anomalies when analyst queries specific data | Continuously monitors cross-system signals; identifies failure precursors before deviation occurs |
| Investigation | Single-batch scope; investigator reviews one batch record at a time | Drafts investigation text from the data provided to it | Autonomously correlates across all historical deviations, equipment logs, environmental data, and material records |
| Trending | Periodic manual review of deviation categories; quarterly reports | Answers trend questions when asked the right query | Maintains a living knowledge graph; detects emerging clusters and escalating risk patterns in real time |
| CAPA | Implemented and verified; effectiveness assumed after closure | Suggests CAPA language based on similar past events | Tracks CAPA effectiveness continuously; flags recurrence of the same root cause pattern post-implementation |
The critical architectural difference at Level 3 is the deviation knowledge graph — a structured, continuously updated map of causal relationships across all deviations, equipment, materials, environmental conditions, and process parameters. Unlike a traditional database that stores records, the knowledge graph stores relationships: “Deviation X was caused by root cause Y, which also caused Deviations A and B, and correlates with equipment condition Z and environmental factor W.”
When a new deviation occurs — or when the agent detects conditions that have historically preceded a deviation — it does not start from a blank investigation form. It queries the knowledge graph to identify which historical patterns match the current conditions, what root causes those patterns resolved to, which CAPAs were implemented, and whether those CAPAs were effective. The investigation begins with context, not from zero.
This is the difference between a system that stores deviations and a system that understands them. Only 6% of manufacturers currently use AI in production (Deloitte, 2025), and the 38% year-over-year increase in documentation-related FDA 483 observations suggests the current approach is not scaling. The knowledge graph architecture addresses both problems simultaneously — it reduces investigation effort while improving investigation quality.
Deployment Evidence
What cross-system deviation intelligence delivers in practice
The architecture described in this whitepaper is grounded in production deployment evidence. Organisations that have built digital quality platforms with cross-system data integration, structured deviation classification, and automated correlation are already measuring the foundational impact — reduced investigation cycles, eliminated manual data reconciliation, and improved root cause identification.
While full predictive deviation intelligence is an emerging capability, the prerequisite architecture — digitised deviation records connected to batch execution data, environmental monitoring, and equipment systems — is delivering measurable results at scale across multi-site pharmaceutical manufacturers.
20→1 days
Batch review cycle
Multi-site manufacturer reduced review from 20 days to 1 day through automated cross-system data aggregation and exception-based workflows
2,700 hrs/year
Manual effort eliminated
Previously spent on data entry, cross-referencing, and manual investigation tasks — now redirected to root cause analysis and process improvement
60%
Reduction in manual data entries
Automated data capture from production equipment eliminates transcription errors and creates the structured data foundation required for pattern detection
These metrics represent the data integration layer — the prerequisite for predictive deviation intelligence. When batch records are digital, deviation records are structured, and cross-system data flows are established, the agent has the foundation it needs to begin building the knowledge graph. The pattern detection, cross-batch correlation, and predictive capabilities layer on top of this digital infrastructure. Organisations that have not yet digitised their deviation records and batch execution data should start there — the agentic layer cannot function on paper-based or disconnected systems.
Implementation Roadmap: Assess, Predict, Prevent
A phased approach to predictive deviation intelligence
Deploying predictive deviation intelligence is not a single project — it is a capability progression. Organisations that attempt to deploy AI pattern recognition on top of unstructured, paper-based deviation records will generate noise, not insight. The roadmap below reflects what the deployment evidence supports as a practical path.
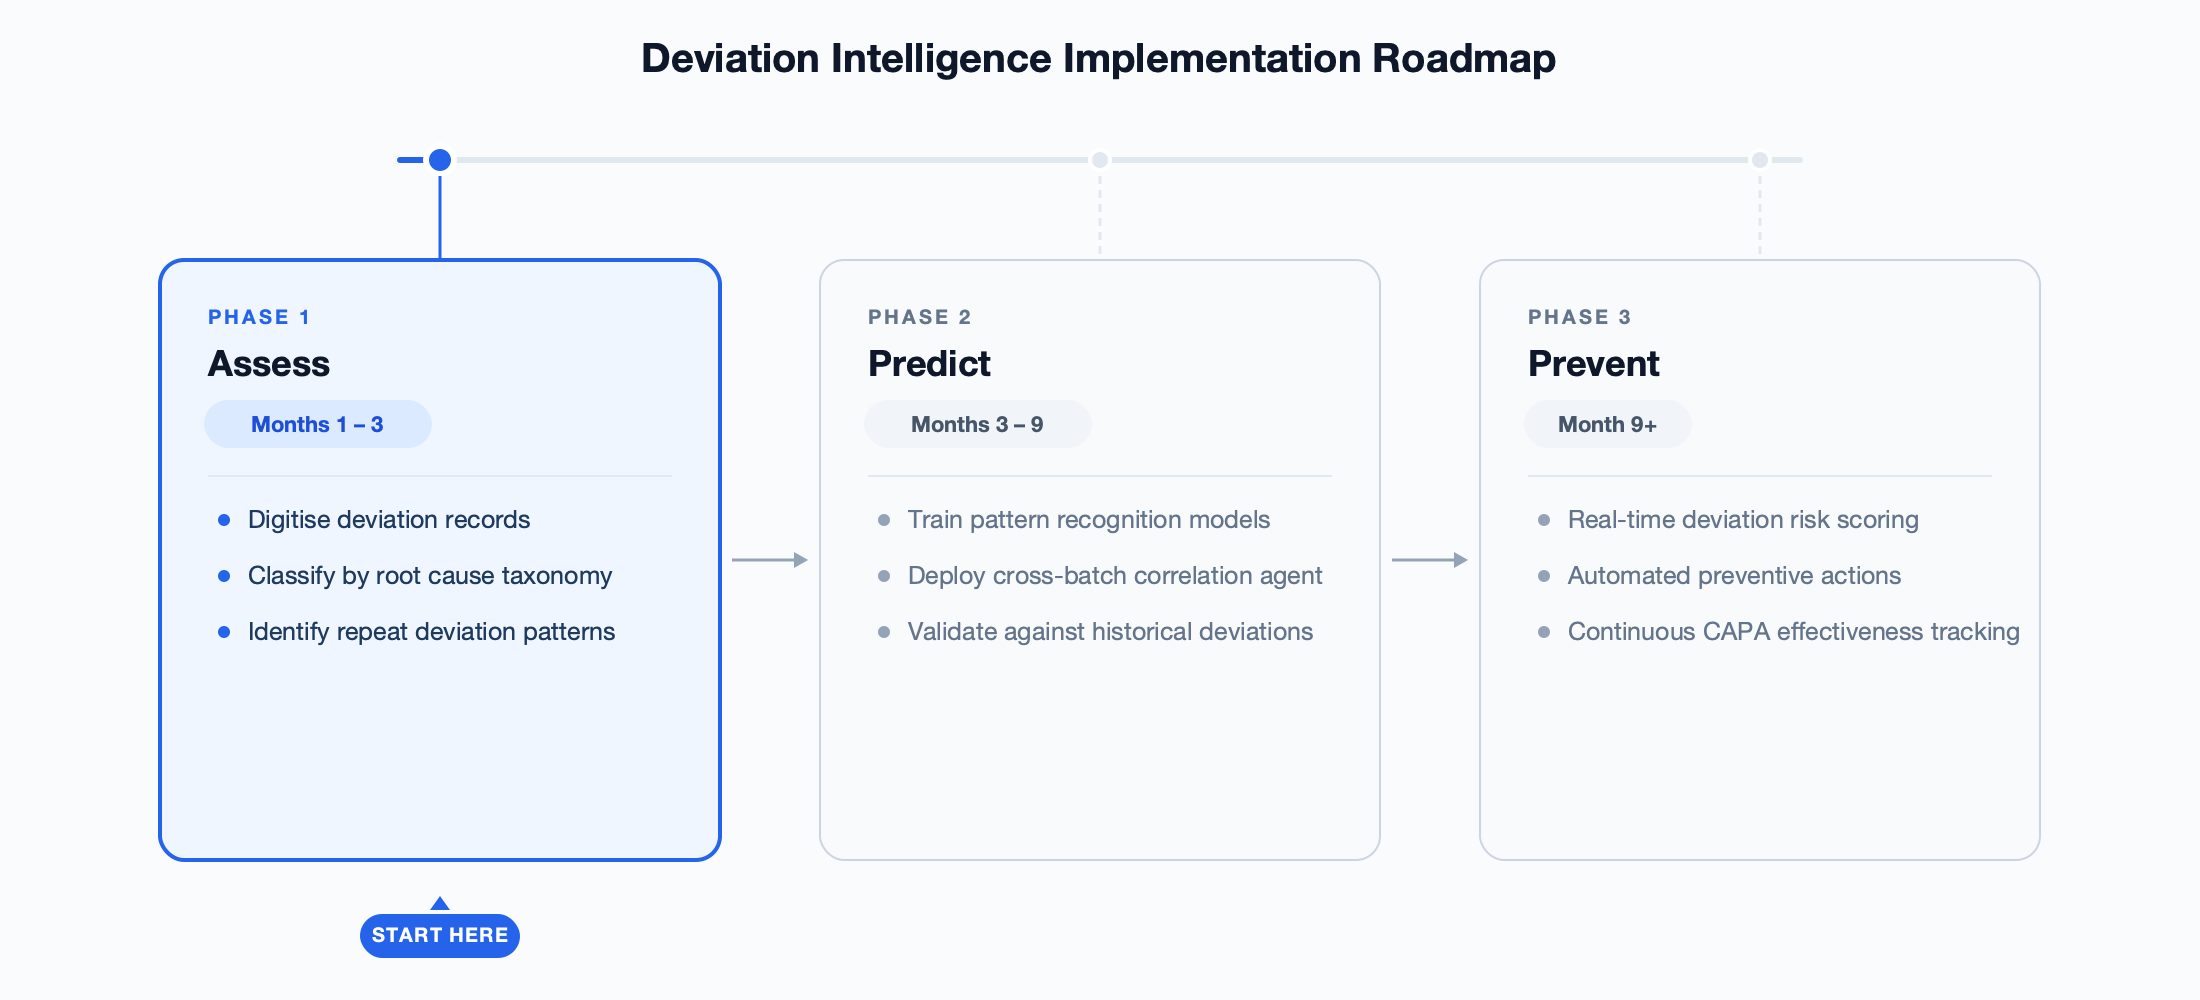
Phase 1: Assess
Digitise all deviation records into structured, searchable formats. Implement a standardised root cause taxonomy that eliminates free-text ambiguity. Connect deviation records to batch execution data, environmental monitoring, and equipment maintenance logs. Analyse historical data to identify the repeat patterns that already exist — most organisations discover that a small number of root causes account for the majority of their deviations.
Phase 2: Predict
Deploy cross-batch correlation agents on the structured historical data. Train pattern recognition models to identify the process, environmental, and equipment signals that have historically preceded deviations. Validate predictions against known outcomes from the historical record — the agent should correctly identify past deviations it was not trained on before being trusted with real-time predictions.
Phase 3: Prevent
Enable real-time risk scoring during batch execution. The agent monitors live process data, compares it against the knowledge graph, and generates risk alerts when conditions match historical failure precursors. Implement continuous CAPA effectiveness tracking — every closed CAPA is monitored for recurrence of the same deviation pattern. Full audit trail maintained at every step for regulatory compliance.
The competitive advantage of predictive deviation intelligence compounds. Every deviation the system investigates makes it better at predicting the next one. Organisations that begin building this institutional knowledge graph now will have a structural advantage that cannot be replicated by late adopters deploying the same technology on a thinner data foundation.
The pharmaceutical industry’s approach to deviation management was built for an era when 50 deviations per quarter was a manageable workload and a single quality manager could maintain mental models of recurring issues across a facility. That era ended when manufacturing scaled to multi-site, multi-product operations generating hundreds of deviations per month across dozens of process lines.
The regulatory environment is tightening in parallel. The 38% year-over-year increase in documentation-related 483 observations signals that the FDA expects not just investigation, but demonstrable learning — evidence that your quality system is connecting events, identifying patterns, and preventing recurrence. A system that investigates 200 deviations independently and closes each one with a site-specific CAPA does not meet that expectation.
Predictive deviation intelligence is not a speculative technology. The foundational components — digital batch records, structured deviation classification, cross-system data integration, and AI-driven pattern recognition — are deployed in production today. The question for quality leadership is not whether to adopt this architecture, but how quickly the transition from reactive investigation to predictive prevention can be executed. Every month spent investigating deviations one at a time is a month of institutional knowledge that never forms — and a month closer to the next inspection where the pattern the system missed becomes the observation that the regulator finds.
Related Articles

The Quality Ontology: Why Pharma AI Needs a Knowledge Graph, Not a Data Warehouse
A technical deep-dive into the quality ontology — the connected knowledge model that enables AI agents to reason across MES, LIMS, QMS, and ERP simultaneously. How the Ontology Builder Agent constructs it, how the signal layer keeps it alive, and why this architecture is the prerequisite for every agentic use case in pharmaceutical manufacturing.

Predictive Product Quality: Why Agentic Architecture Outperforms ML Models and Dashboards
Product quality prediction requires a network of specialised AI agents — not a single ML model. How agents, skills, sub-agents, and standardised tool interfaces deliver continuous risk intelligence that annual CPV reviews structurally cannot.

Agentic AI vs. AI Copilots in Pharma: Why Architecture Determines Impact
Most pharma AI deployments are copilots — reactive, single-step, human-prompted. Agentic AI is architecturally different: goal-directed, multi-step, and autonomous within guardrails. A technical framework for CIOs.
Newsletter
Stay ahead in the Industry
Regulatory updates, pharma quality insights, and AI in manufacturing — written for quality leaders, not marketers.
Please use your official work email. Personal email addresses (Gmail, Yahoo, etc.) will not receive the newsletter. No spam. Unsubscribe anytime.
Ready to see what an AI-native quality platform looks like? Leucine unifies quality management, regulatory compliance, and production operations into one intelligent system.
