Key Takeaways
Traditional pharma data architecture stores quality data in disconnected silos — deviations in QMS, batch records in MES, analytical results in LIMS, material data in ERP. No SQL query across these systems can answer: 'Which material lots correlate with dissolution drift across all products and sites?' A quality ontology — a connected knowledge graph — can.
The ontology is not hand-coded by engineers. It is built by an AI agent — the Ontology Builder — that discovers data across source systems via MCP tool interfaces, proposes a domain-meaningful entity and relationship structure, validates mappings against real data, and generates the ETL pipelines that keep the ontology alive. Human quality experts approve every structural decision.
What makes the ontology a quality intelligence system — not just a data integration layer — is the signal layer: continuously computed metrics on every entity and every relationship in the graph. A product node carries its current Ppk, OOS probability, and trend direction. A Product→Material edge carries a sensitivity coefficient showing how strongly material variability affects that product's CQAs.
When an AI agent needs to reason about a quality question, it doesn't query raw data from six systems. It pulls a context graph — the relevant subgraph with all current signal values loaded — and reasons over pre-computed intelligence in seconds. This is the architectural prerequisite for every agentic use case: CPV, risk scoring, APQR, CAPA recommendation, and predictive quality management.
Consider a question that a VP Quality at a multi-site pharmaceutical manufacturer might ask: “Which of our products are at risk from the particle size variability we’re seeing in MCC lots from Supplier B?”
To answer this properly, you need to traverse data across at least four systems:
- ERP — which products use MCC from Supplier B, and which material lots have been received recently?
- LIMS — what are the incoming CoA results for those lots, specifically particle size D90?
- MES — which batches consumed those lots, and what were the in-process and release results?
- QMS — have any deviations been raised for those batches, and what were the root causes?
And you need to do this not just for one product, but across every product that uses MCC, across every manufacturing site, with enough historical depth to establish whether the particle size trend is real and whether it correlates with quality outcomes.
No QA analyst does this routinely. The data lives in four separate systems with different schemas, different naming conventions, and no shared context. The analyst would need days — or weeks — to manually extract, align, and analyse the data. In practice, they don’t. They investigate the deviation in front of them, in the system where it was logged, with whatever batch-specific context they can manually gather.
This is not a people problem. It is an architecture problem. And the architecture that solves it is not a data warehouse, not a data lake, and not a BI dashboard. It is a quality ontology — a connected knowledge graph where relationships carry meaning, enriched with a signal layer that maintains computed intelligence on every node and every edge, continuously updated as manufacturing data flows in.
This whitepaper describes what a quality ontology is, how it gets built by an AI agent, and why it is the prerequisite for every agentic use case in pharmaceutical manufacturing.
A data warehouse stores facts. A knowledge graph stores facts and the relationships between them. In pharmaceutical manufacturing, the relationships are where the intelligence lives: a batch consumed a material lot on an equipment train that was last maintained 620 batches ago in a room where humidity exceeded historical norms. No single system captures this chain. The ontology does.
What Is a Quality Ontology?
A connected knowledge model that represents every entity in pharmaceutical manufacturing that matters for quality — and the relationships between them.
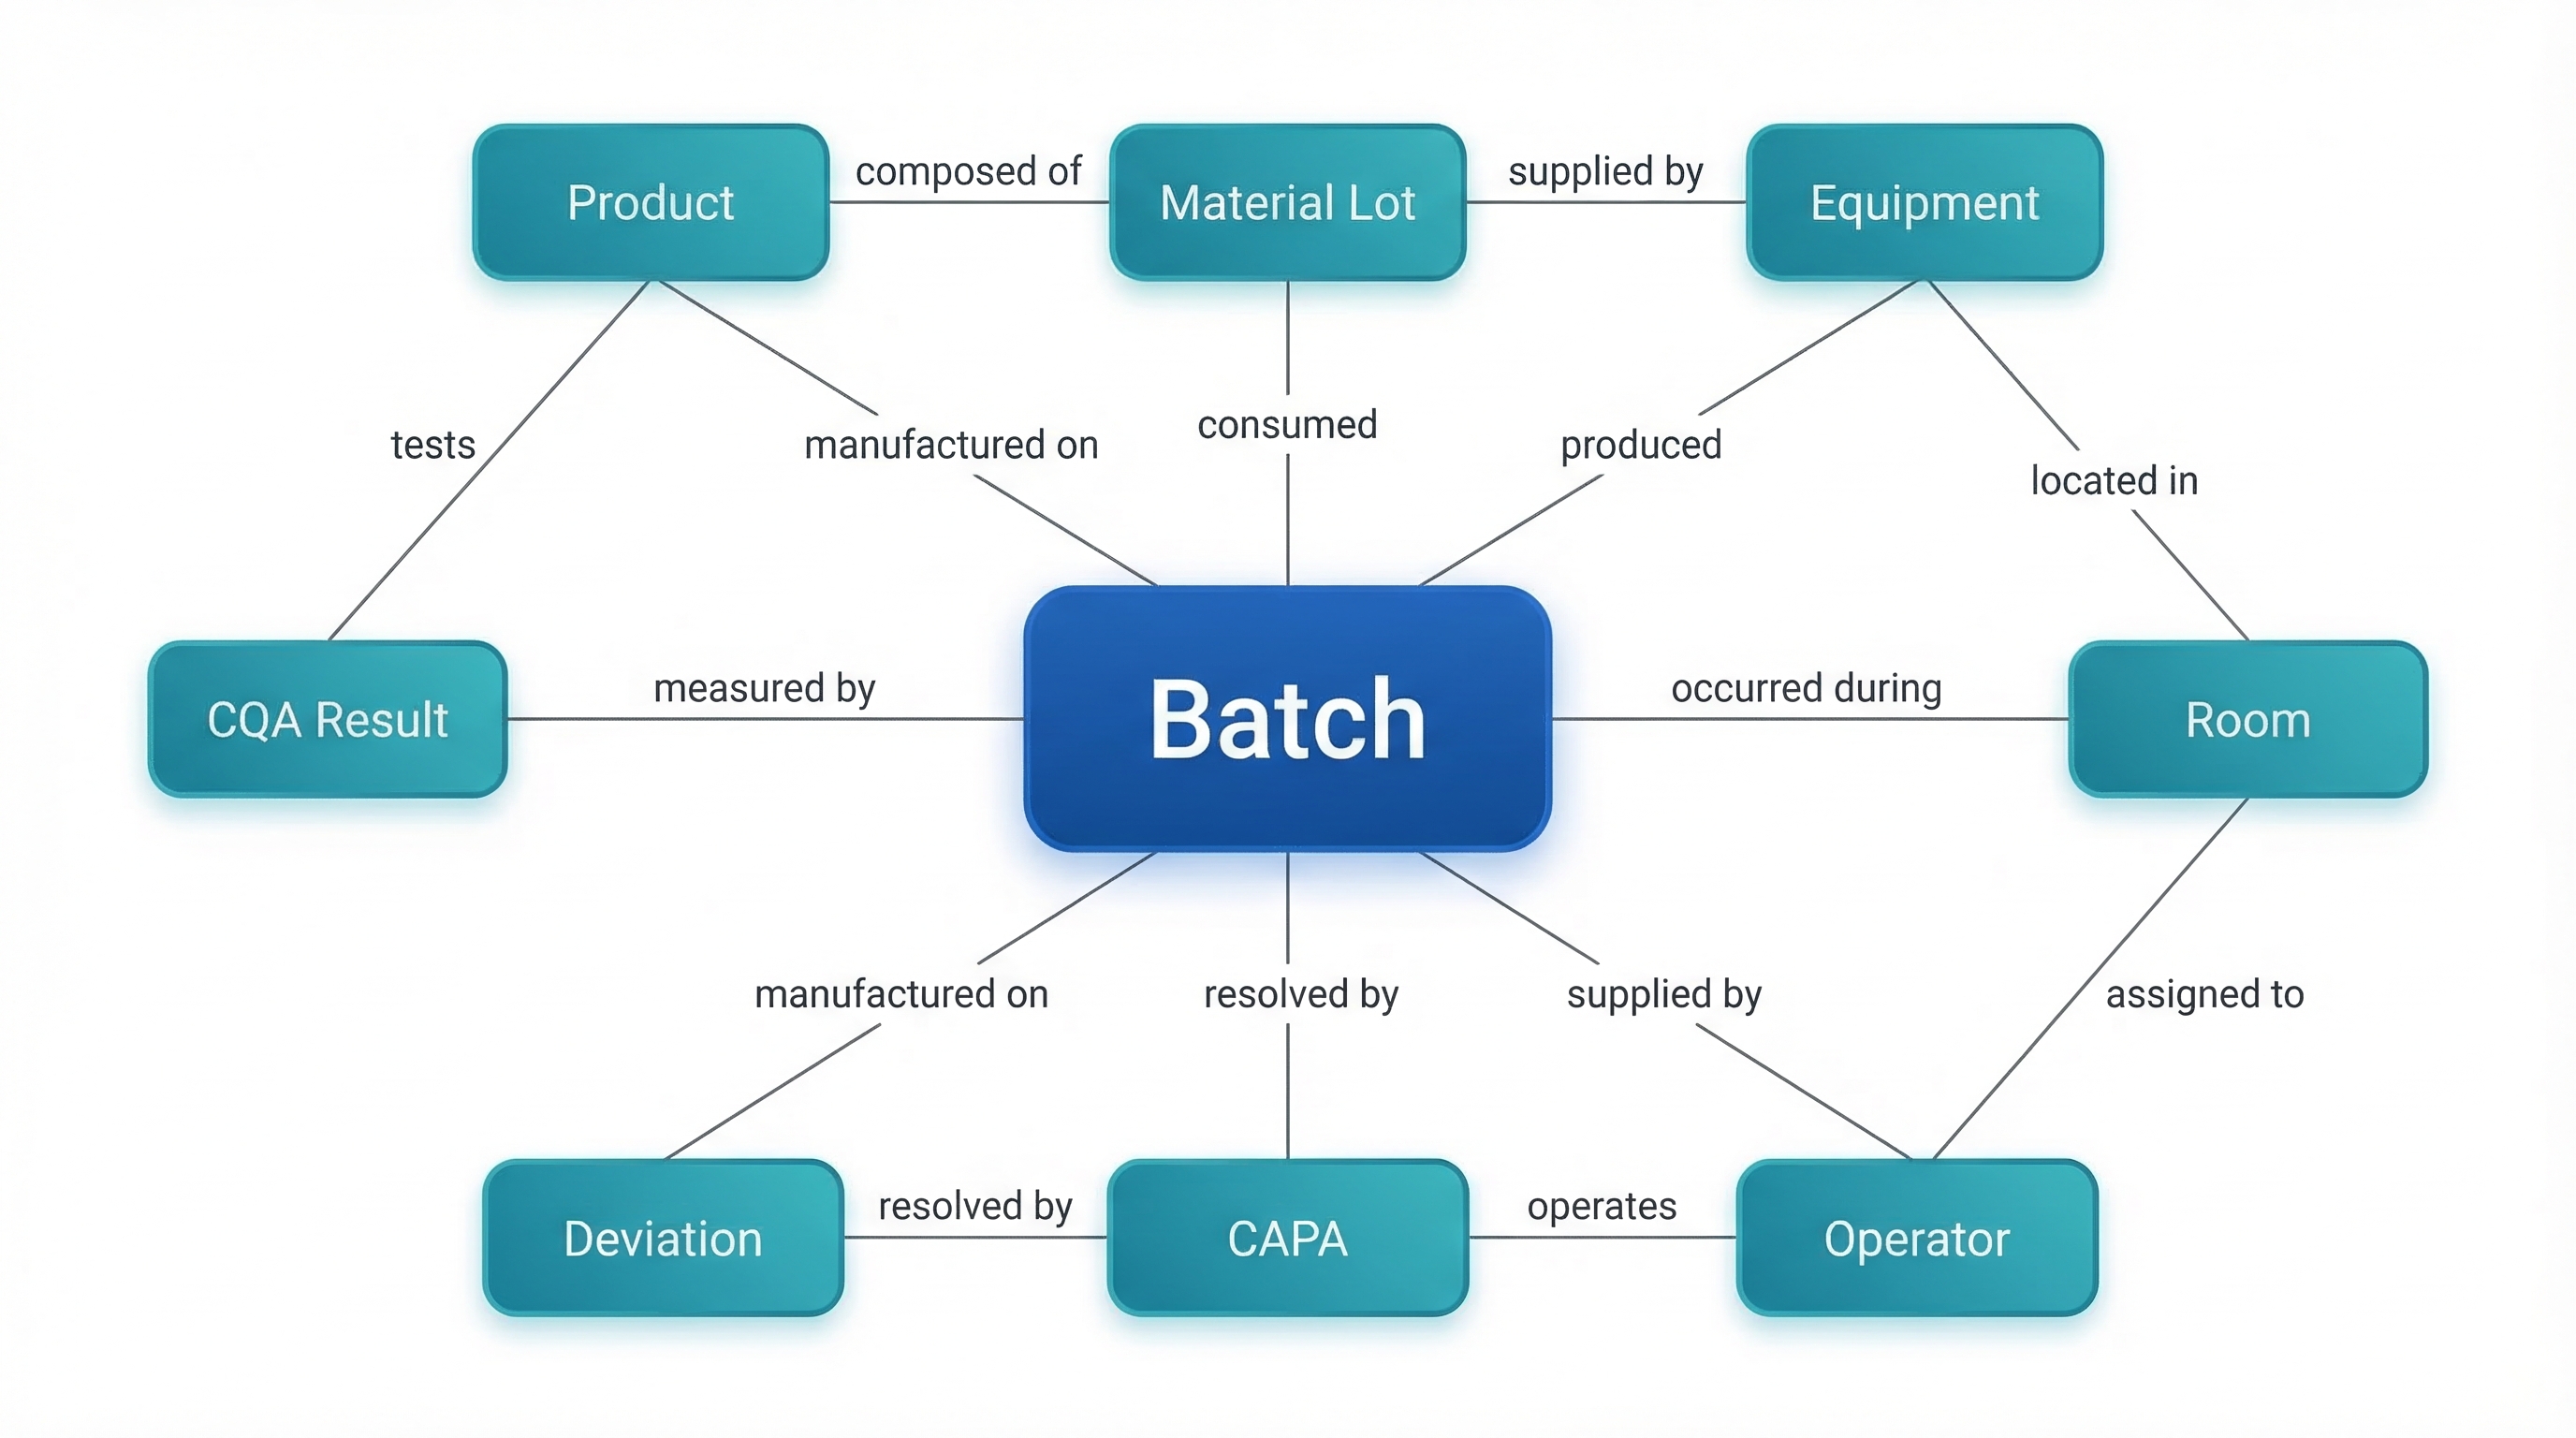
The quality ontology is a knowledge graph where the nodes are manufacturing entities — products, batches, CQAs, CPPs, raw materials, material lots, equipment, rooms, operators, deviations, CAPAs, stability studies, complaints, and specifications — and the edges are the relationships between them.
These relationships are first-class citizens in the ontology. They are not foreign keys in a relational database. They carry domain meaning:
- A Batch was manufactured using a Material Lot on an Equipment Train by an Operator in a Room under specific Environmental Conditions
- That Batch produced CQA Results that are governed by Specifications and trended against Process Capability history
- That Material Lot was supplied by a Supplier and has a Certificate of Analysis with Material Attributes (particle size, moisture, purity)
- A Deviation occurred during that Batch and was investigated with a Root Cause and resolved through a CAPA
- That Product is also manufactured at Site B, where the same CQAs are measured but different equipment is used
These relationships are what enable an agent to answer questions that no single system can answer. “Which material lots correlate with dissolution drift?” requires traversing from LIMS results → batch records → material lots → supplier data. “Which other products are at risk?” requires traversing from material lot → all batches using that lot → all products → their CQA trends. No SQL query across disconnected systems can do this. The ontology can.
Cross-System Quality Reasoning
QA analyst receives dissolution alert from LIMS → opens MES to check batch record → manually notes the material lots → opens ERP to check supplier data → opens QMS to search for related deviations → builds a spreadsheet to correlate the data → spends 3-5 days on the investigation → writes a report based on manual cross-referencing across 4+ systems.
3–5 days per investigation, limited to one product at a time
AI agent detects dissolution trend → traverses the ontology from CQA results to batches to material lots to supplier data in seconds → identifies the material attribute correlation → checks all other products using the same material → assesses cross-site impact → generates a complete investigation with evidence chain and recommended CAPA.
Seconds to minutes, across all products and sites simultaneously
How the Ontology Gets Built: The Ontology Builder Agent
The ontology is not hand-coded by engineers. It is built by an AI agent working with human quality experts in a structured, iterative process.
Building a quality ontology manually — mapping every entity, every relationship, every field from every source system — would be a multi-month data engineering project. It would require deep knowledge of every system’s schema, every naming convention, every data format quirk. And it would be outdated the moment a new system was connected or a new product was launched.
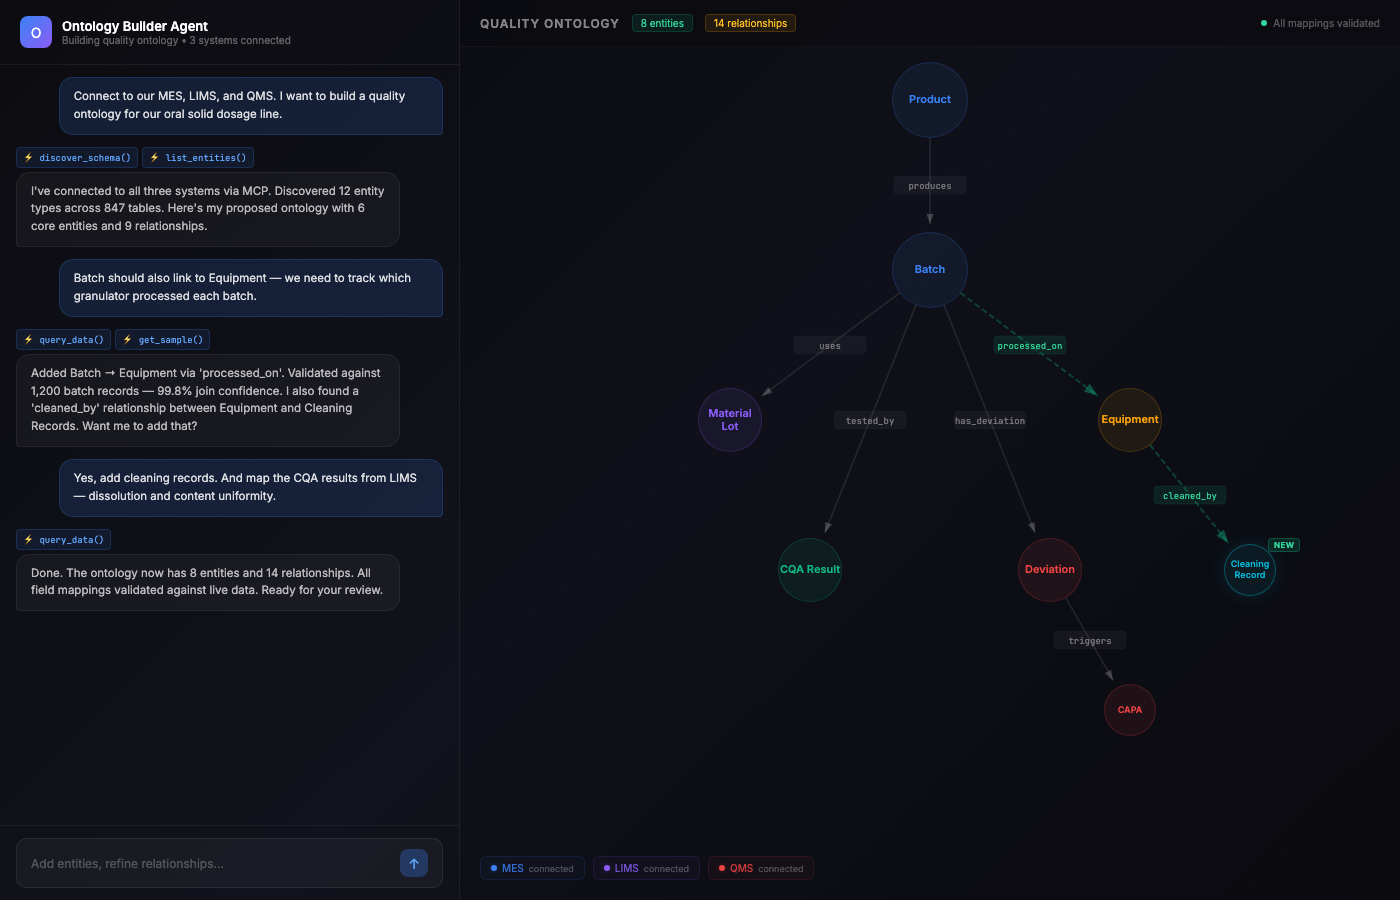
In Celestara, the ontology is built by the Ontology Builder Agent — the base Celestara agent equipped with a specialised Ontology Builder skill. The quality expert works with the agent through a conversational interface: directing which systems to connect, reviewing proposed entities and relationships, and refining the ontology as the graph materializes in real time.
The agent has access to two categories of capabilities:
MCP Tools — one tool per connected source system. Each MCP tool is a purpose-built connector that can query, discover, and extract data from a specific system:
mes-tool: connects to the MES (PAS-X, MESPAS, or Celestara MES). Lists batch records, queries process parameters, retrieves in-process results, enumerates equipment and room metadata.lims-tool: connects to the LIMS (LabWare, STARLIMS, Empower). Lists test methods, retrieves analytical results, queries specifications, enumerates instruments.qms-tool: connects to the QMS (Veeva, TrackWise, MasterControl). Lists deviations, investigations, CAPAs, change controls, complaints, and their relationships.erp-tool: connects to the ERP (SAP, Oracle). Queries material master data, supplier records, material lot receipts, inventory, and bill of materials.stability-tool: connects to the stability data system. Retrieves study designs, time-point results, storage conditions.env-monitoring-tool: connects to the environmental monitoring system. Retrieves room classifications, particle counts, temperature/humidity logs.
Each MCP tool exposes a consistent interface — discover_schema(), list_entities(), query_data(), get_sample() — allowing the agent to explore any connected system without system-specific knowledge hard-coded into the agent itself.
Ontology Builder Skill — a specialised skill that provides the agent with capabilities to propose entity types, propose relationships, map source fields to ontology attributes, validate mappings against sample data, and generate data lineage documentation.
The building process follows five structured steps, each with human-in-the-loop validation.
Step 1 — System Discovery
The agent uses each MCP tool to discover what data exists across all connected systems. It calls discover_schema() on MES, LIMS, QMS, and ERP to understand the data landscape: what entities exist, what attributes they have, and — critically — what the join keys are. For example, it discovers that batch_id appears in MES, LIMS, and QMS, establishing the cross-system link between production, testing, and quality events.
The agent discovers the data landscape automatically — no manual schema documentation required.
Step 2 — Ontology Proposal (Human-in-the-Loop)
The agent proposes an initial ontology structure based on what it discovered. This is where LLM reasoning is critical — the agent doesn’t just list tables, it understands pharmaceutical manufacturing and proposes a domain-meaningful ontology: Product, Batch, CQA Result, CPP Reading, Material Lot, Equipment, Deviation, CAPA. It proposes relationships: Batch uses Material Lot, Batch produced CQA Result, Deviation resolved by CAPA. And it asks specific questions: “Your LIMS has 47 test codes — which are CQA tests vs. routine? I see 23 deviations with no batch_id — should these link to Equipment or Room?”
The quality team reviews, answers questions, and approves or modifies. The agent shows its work and waits for confirmation.
Step 3 — Field Mapping and Sample Validation
With the structure approved, the agent maps specific fields from each source system to ontology attributes. For every mapping, it pulls sample data through the MCP tools and validates: “LIMS.test_results.result → CQAResult.measuredValue. Sample: Batch B-2024-0887, Test Dissolution, Result: 85.2%. Value is numeric, within expected range, units match.” It surfaces discrepancies: “LIMS uses product code MET-500 while MES uses METFORMIN-500MG. 12 products have mismatched codes — recommend creating a mapping table.”
Every mapping is validated against real data. Discrepancies are surfaced — not silently ignored.
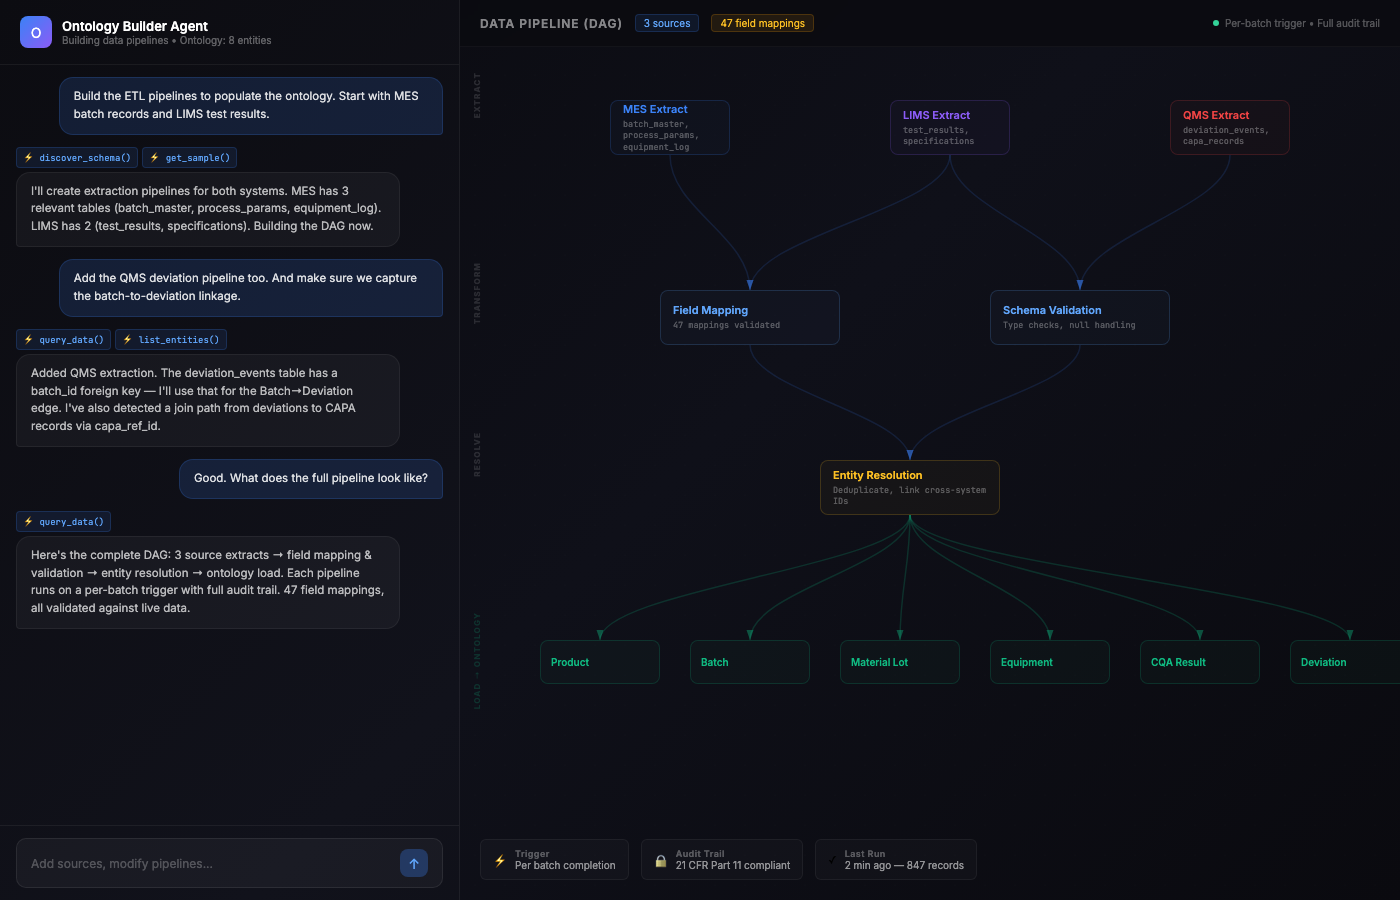
Step 4 — Data Lineage and ETL Generation
The agent generates full data lineage documentation and executable ETL pipelines. For every attribute in the ontology, it documents: source system, source field, transformation applied, join path, refresh frequency, and validation rules. It produces working extraction scripts that use the MCP tool interfaces to pull, transform, validate, and load data — with scheduling configuration for real-time (API-connected), batch (daily dumps), and one-time (historical loads).
Data lineage is a first-class concept — every ontology attribute traces back to its exact source record.
Step 5 — Continuous Evolution
The ontology is not static. When a new LIMS test is added for a product, the agent detects it during the next data sync, proposes an ontology update (“New test code IMPURITY-D detected for Product X. Classify as CQA?”), and waits for human approval before implementing. When a new system is connected, the agent discovers its schema and proposes how it should integrate into the existing ontology. The ontology evolves with the manufacturing operation.
Every structural change requires human approval. The agent proposes — humans decide.
Once the ontology structure is validated, the agent builds the data pipelines that keep it alive — the full extraction, transformation, and loading DAG, generated through the same conversational process.
The Signal Layer: From Data Integration to Quality Intelligence
The ontology structure is the skeleton. The signal layer is what makes it alive.
A knowledge graph with entities and relationships is a powerful data integration tool. But integration alone doesn’t answer quality questions. Knowing that a batch consumed a material lot is useful. Knowing that material lot variability has a 0.78 sensitivity coefficient to dissolution for that specific product — and that the sensitivity is increasing — is intelligence.
This is the signal layer: continuously computed metrics that live on every entity and every relationship in the graph, evolving as new manufacturing data flows in. Signals are not raw data. They are derived intelligence — computed by statistical tools that the agent invokes, maintained on the graph so that the agent can reason over them instantly without recomputing from scratch.
| Entity | Example Signals |
|---|---|
| Product | Current robustness score, OOS probability per CQA, Ppk values per CQA, deviation frequency (trailing 6 months), batch success rate, quality trend direction (improving / stable / degrading) |
| Material (by supplier) | Lot-to-lot variability index per attribute, incoming quality trend over last N lots, number of lots triggering downstream CQA drift, supplier reliability score |
| Equipment | Batches since last maintenance, quality output trend (Ppk of batches on this equipment over time), cleaning effectiveness score, equipment-specific yield contribution |
| Room / Environment | Temperature and humidity stability index, excursion frequency, seasonal pattern indicators |
| Supplier | Quality trajectory (improving / stable / declining), delivery reliability, change notifications in trailing 12 months, lots rejected or on hold |
| CQA (per product) | Current Ppk, Ppk velocity (rate of change per batch), distance to specification limit, trend classification (mean shift / gradual drift / cyclical / stable) |
| Deviation | Recurrence flag, time to closure, CAPA effectiveness outcome |
But the signal layer becomes uniquely powerful when applied to relationships — the edges in the graph. Relationships in a traditional database are binary: Product X uses Material Y. In the signalled ontology, relationships carry quantitative intelligence about the nature of that connection:
| Relationship | Example Signals |
|---|---|
| Product → uses → Material | Sensitivity coefficient: how strongly does variability in this material's attributes affect this product's CQAs? Which specific material attributes matter most? Is the sensitivity increasing or decreasing over time? |
| Product → manufactured on → Equipment | Equipment-specific quality offset: does this product perform differently on Line 1 vs. Line 2? By how much? Is the gap widening or narrowing? |
| Product → tested by → LIMS Method | Method variability contribution: how much of the observed CQA variability is attributable to analytical method variability vs. true process variability? |
| Material → supplied by → Supplier | Supplier quality trajectory for this specific material: is lot-to-lot consistency improving or degrading? |
| Equipment → located in → Room | Environmental sensitivity: how strongly do room conditions affect quality outcomes on this equipment? |
Edge signals are what transform the ontology from a data integration platform into a quality intelligence system. Knowing that Product X uses MCC is a fact. Knowing that Product X has a 0.78 sensitivity coefficient to MCC particle size D90 — and that this sensitivity has increased from 0.52 to 0.78 over the last 6 months, likely due to a formulation-equipment interaction on Compression Line 3 — is intelligence that enables predictive quality management.
How Signals Are Computed and Maintained
Signals are not computed once. They are continuously maintained as manufacturing data flows into the ontology.
Signal computation is triggered by data events flowing through the ontology:
When a new batch’s CQA results arrive from LIMS, the agent recalculates: the product’s Ppk values, the CQA trend classification, the OOS probability projection, and the material sensitivity coefficients for the material lots used in that batch.
When a new material lot arrives (CoA data ingested from ERP/supplier quality), the agent recalculates: the supplier’s lot-to-lot variability index, the material quality trend, and checks whether the lot’s attributes fall in a range that historically correlates with quality risk for any product that uses this material.
When an equipment maintenance event is logged, the agent resets the “batches since maintenance” counter and recalculates the equipment quality output trend.
These are quantitative signals — computed by statistical tools the agent invokes. But the ontology also maintains qualitative signals — generated by the agent’s LLM reasoning over the quantitative signals and contextual data:
A risk narrative on a product entity: “Product X quality is stable overall, but dissolution margin is narrowing due to increasing MCC particle size variability from Supplier B. Two corrective actions are in progress. If the material trend continues without intervention, OOS probability will exceed acceptable threshold within 8 weeks.”
A supplier assessment on a supplier entity: “Supplier B has shown a gradual increase in MCC particle size D90 over the last 5 lots, moving from the middle of the specification range toward the upper boundary. No change notification has been received. This is not yet a specification exceedance but is creating downstream quality pressure for 3 products.”
A relationship insight on a Product→Equipment edge: “Product X produces consistently lower dissolution on Compression Line 3 compared to Line 1 (mean difference: 2.3%). Gap has widened from 1.1% to 2.3% over the last 6 months. Correlation with Line 3 tooling age suggests punch wear as the contributing factor.”
These qualitative signals are not static text. They are regenerated as the underlying quantitative signals change, ensuring the narrative always reflects the current state.
The Context Graph: How Signals Power Agent Reasoning
When the agent needs to answer a question, it doesn't query raw data from six systems. It pulls a context graph.
This is the mechanism that connects the ontology to every downstream use case. When an agent needs to reason about a specific quality question — “Should we be concerned about Product X’s dissolution trend?” — it assembles a context graph: the relevant subgraph of the ontology with all current signal values loaded on the nodes and edges.
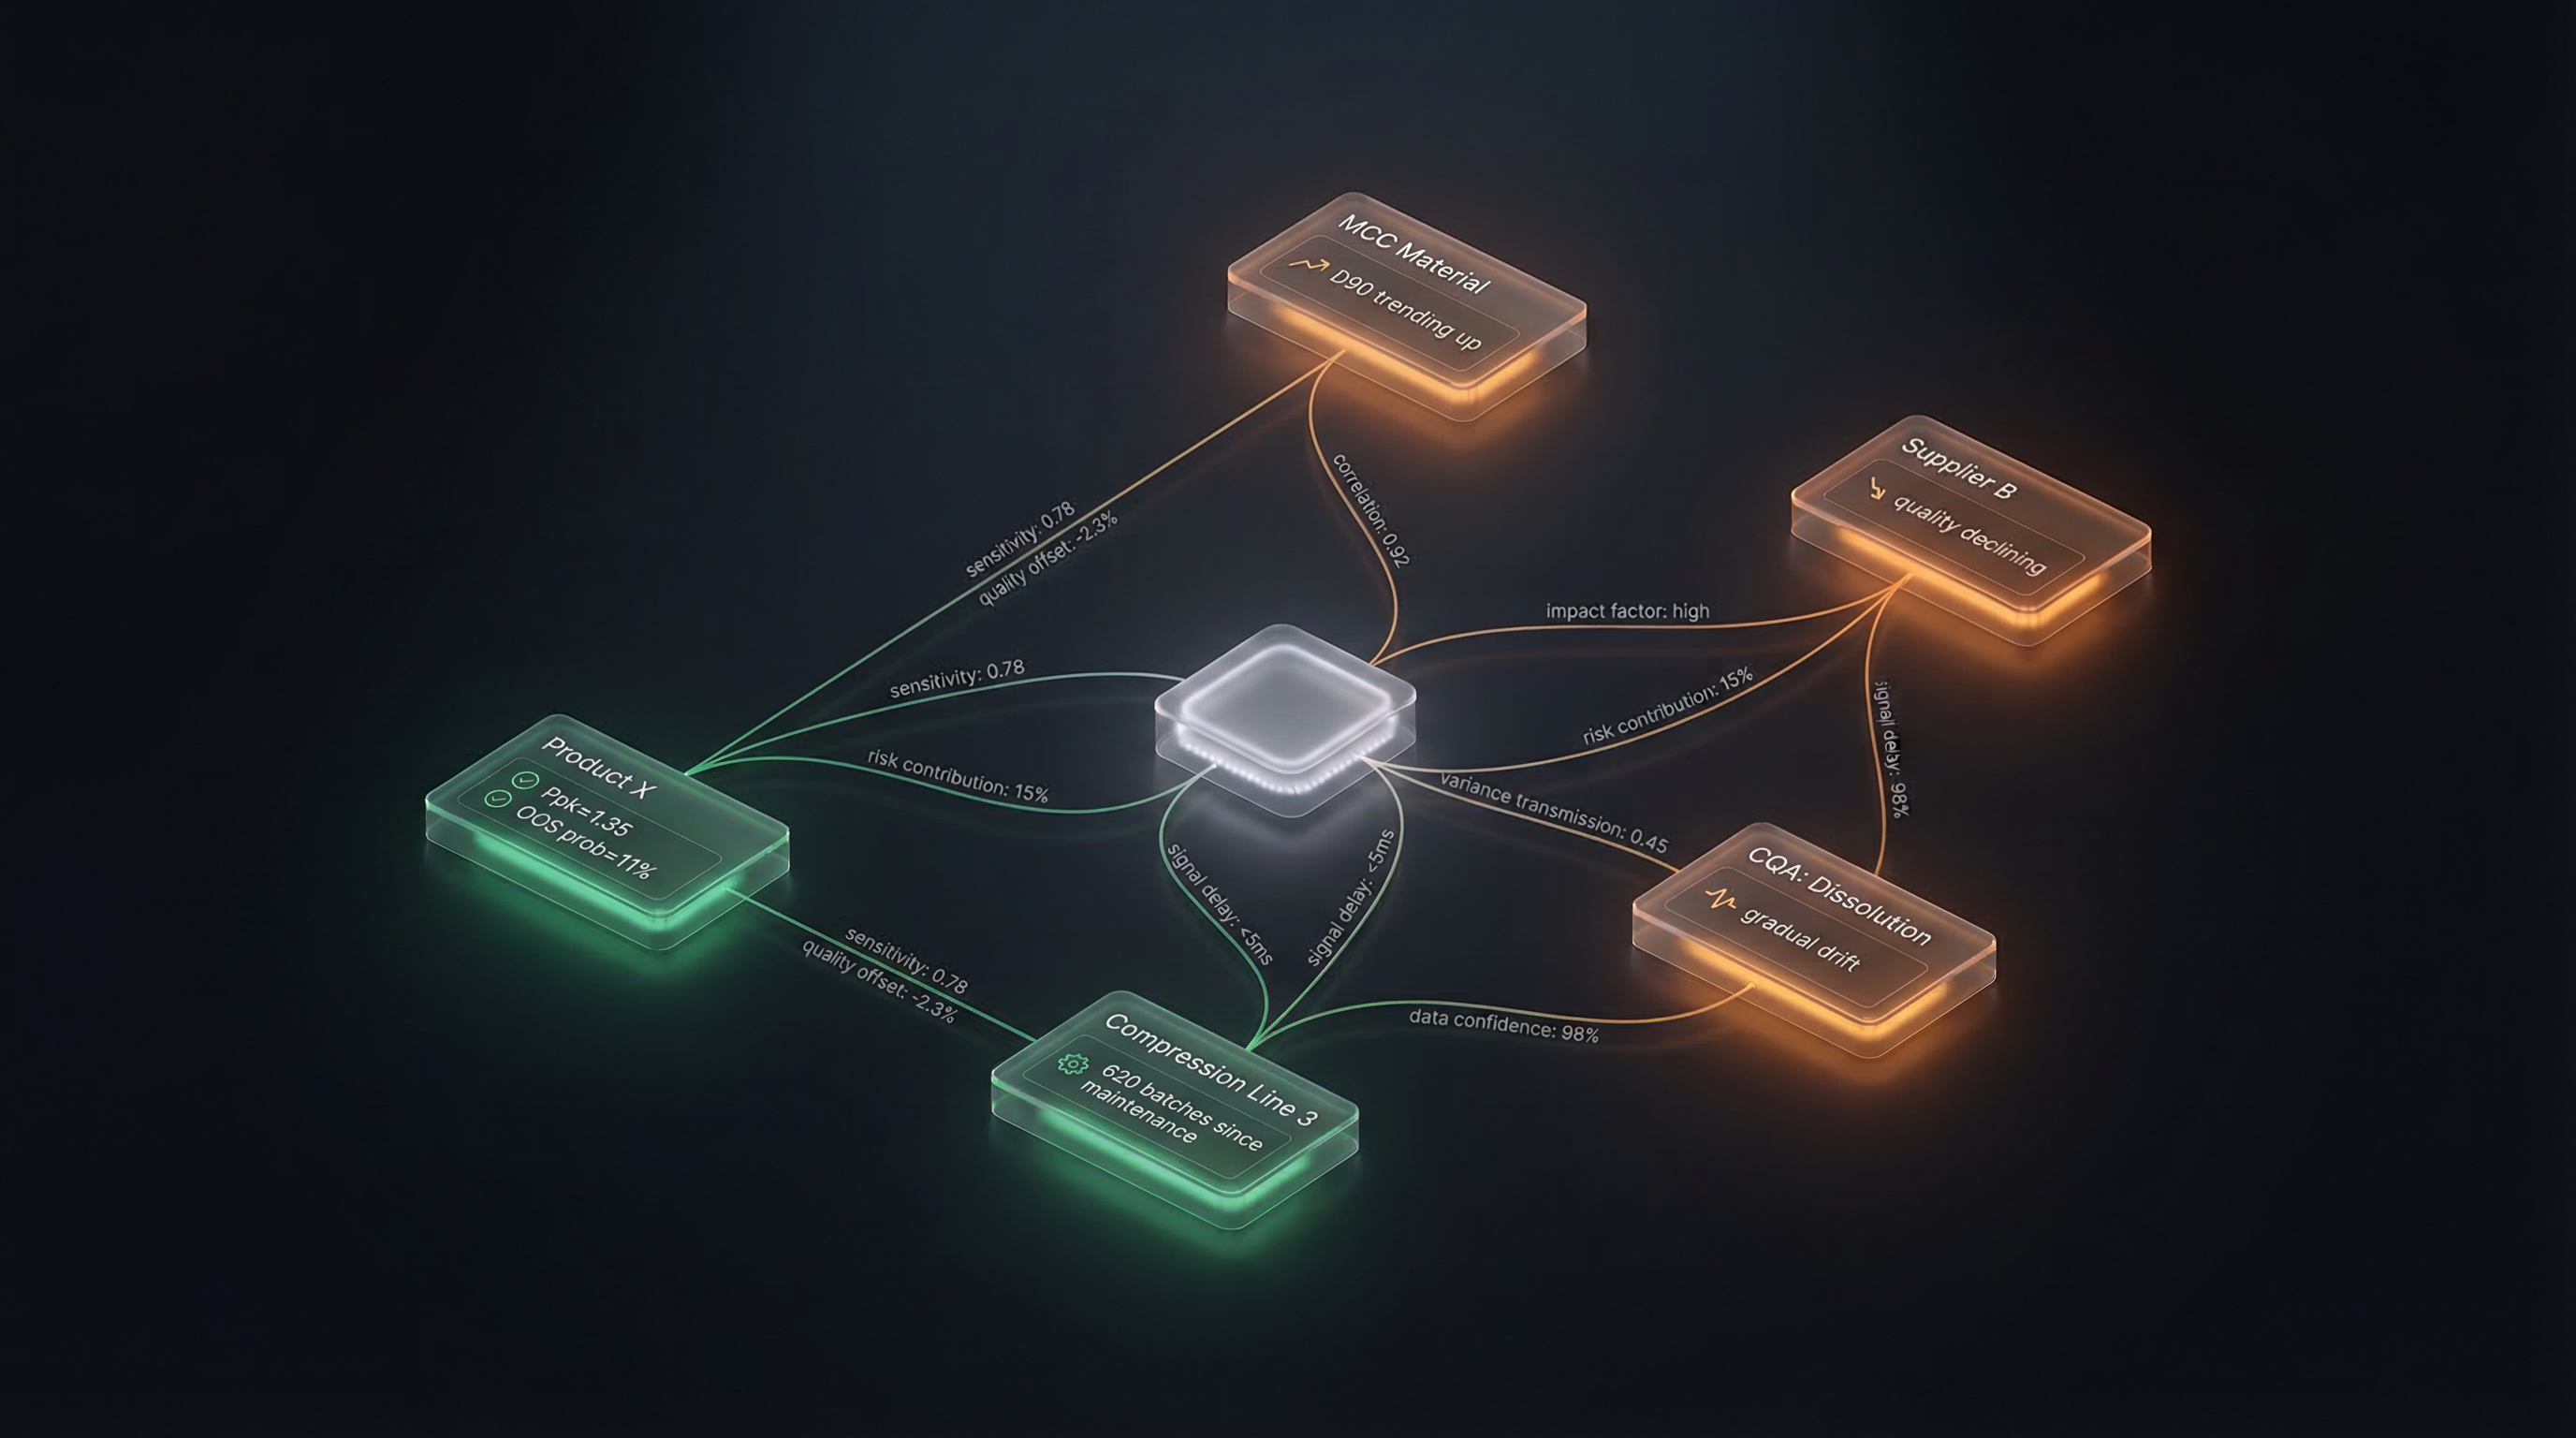
For Product X’s dissolution question, the context graph includes:
- Product X node with signals: Ppk for dissolution = 1.35 (declining), OOS probability = 11%, trend classification = gradual drift
- Edge: Product X → uses → MCC with signal: sensitivity coefficient for dissolution = 0.78 (high), material attribute that matters most = particle size D90
- MCC Supplier B node with signal: PSD variability trending upward, quality trajectory = declining
- Recent MCC lots with signals: D90 values of 172, 178, 185, 188, 192μm over last 5 lots
- Compression Line 3 node with signal: 620 batches since tooling change (recommended: 500), quality output trend = slightly declining
- Edge: Product X → manufactured on → Line 3 with signal: equipment-specific quality offset for dissolution = -2.3% vs. Line 1
The agent doesn’t need to compute any of this at reasoning time. The signals are already on the graph, maintained by signal computation skills. The agent’s job is to assemble the context graph, read the signals, and reason about what they mean together:
“Dissolution is declining because of two compounding factors: material particle size is increasing (high sensitivity edge signal) and equipment quality is degrading (tooling age signal). Each factor alone accounts for roughly half the observed Ppk decline. Both are addressable independently.”
This is the fundamental mechanism behind every functional capability. The agent reasons over a signalled graph — not over raw data, not over pre-built ML models, not over dashboards. The signal layer transforms the ontology from a data integration platform into a quality intelligence system.
Without the signal layer, the agent would need to recompute everything from raw data on every query — slow, expensive, and unable to maintain the historical trajectory intelligence that makes prediction possible. With the signal layer, the intelligence is pre-computed, continuously maintained, and instantly available for reasoning.
Use Cases Powered by the Ontology
Every agentic quality use case is downstream of the signalled ontology.
The quality ontology is not a standalone product. It is the foundation layer that enables every agentic use case in pharmaceutical manufacturing. Here is how the ontology’s capabilities — entity relationships, signal computation, and context graph assembly — map to specific quality operations:
Continuous Process Verification (CPV)
The agent maintains live CPV models for every product by monitoring CQA signals on product nodes and CPP signals on batch nodes. When a trend is detected, the agent assembles the context graph — material lots, equipment state, environmental conditions — and investigates the probable cause in seconds. It doesn't just flag that Ppk is declining; it explains why, quantifies the contributing factors, and projects when the threshold will be breached if nothing changes.
Product Quality Risk Scoring
Every product carries a continuously updated robustness score computed from multiple ontology signals: Ppk trends across all CQAs, material quality signals, deviation frequency, stability trajectories, and equipment performance. The agent generates an explainable risk narrative — not just a number, but a decomposition of which factors are contributing to risk and by how much. When risk increases, the agent identifies which upstream changes are responsible and what interventions would reduce it.
Automated APQR Generation
The Annual Product Quality Review becomes a report that writes itself. The agent aggregates signals across the product's ontology subgraph for the review period: batch success rates, CQA trends, deviation summaries, CAPA effectiveness, stability data, material quality trajectories, and equipment performance. It generates the narrative sections — not template fill-ins, but genuine analysis of the product's quality story during the review period, with forward-looking recommendations.
The pattern is consistent across use cases. The ontology provides the connected data. The signal layer provides the pre-computed intelligence. The context graph provides the scoped reasoning input. The agent provides the domain reasoning and natural language output. No use case requires building custom software — each is delivered by configuring a skill that tells the agent what to reason about and how to act on its conclusions.
Why Not a Data Warehouse?
The architectural decision that determines whether your AI can reason or just report.
Cross-System Reasoning
Stores data from multiple systems in a centralised repository. Schema-on-write (warehouse) or schema-on-read (lake). Relationships between entities are implicit — expressed through JOIN operations on shared keys. Every analytical question requires writing a new query that explicitly specifies the join path. Adding a new relationship or entity type requires schema migration. No computed intelligence on the data — every query recomputes from raw records.
Good for: structured reporting on known questions
Stores entities AND their relationships as first-class objects. Relationships carry domain meaning and computed signals. Traversal across entity types is native — no JOINs required. An agent can navigate from a CQA result to the material lot to the supplier to all other products using that supplier in a single graph traversal. New entity types and relationships are added by the Ontology Builder Agent without schema migration. Signal layer maintains pre-computed intelligence that evolves with every new data point.
Good for: reasoning across system boundaries on novel questions
Handling Novel Questions
A new question ('Which equipment-material-environment combination produces the highest write-off risk?') requires a data engineer to design the query, identify the right tables, specify join conditions, and build the aggregation logic. Turnaround: days to weeks. If the required data relationship wasn't anticipated in the schema design, it may require a schema change.
New question = new development effort
The same question is answered by the agent traversing the ontology: navigate to write-off events, follow edges to equipment, material lots, and environmental conditions, compute the co-occurrence pattern, and identify the high-risk combination. No new query development. No schema changes. The agent reasons over the existing graph structure and signal layer to answer questions that weren't anticipated when the ontology was built.
New question = same graph, same agent, instant traversal
Implementation Architecture
How the ontology fits into an enterprise pharma IT landscape.
Non-invasive integration via MCP tools.
The ontology does not replace MES, LIMS, QMS, or ERP. It reads from them via MCP tool connectors — purpose-built interfaces that use each system's native APIs. The source systems remain the systems of record. The ontology is a read-only knowledge layer that aggregates and contextualises data from all connected systems. No data migration. No system replacement. No disruption to existing workflows.
Incremental deployment.
The ontology doesn't need to be built in one pass. Start with MES and LIMS for a single product line. The Ontology Builder Agent discovers the data, proposes the structure, and you validate. Add QMS when you're ready. Add ERP material data when the first use case demands it. Each new system connection extends the ontology — the agent proposes updates, humans approve, and the signal layer recalculates. The ontology grows organically with your needs.
GMP-compliant by architecture.
Every ontology attribute carries full data lineage: source system, source field, extraction timestamp, transformations applied, and validation rules checked. Every agent decision is audit-trailed under 21 CFR Part 11. Every signal computation is traceable to its input data. The ontology's lineage layer is not an afterthought — it is a structural requirement enforced by the Ontology Builder Agent during the mapping and ETL generation steps.
Multi-site, multi-instance ready.
The ontology is designed for multi-site pharmaceutical manufacturers. Different sites may use different MES instances, different LIMS configurations, different QMS systems. The Ontology Builder Agent maps each site's systems to the shared ontology structure, resolving naming differences, unit conversions, and schema variations. The result is a unified knowledge graph where the agent can reason across sites — comparing equipment performance, material quality, or process capability between facilities — even when the underlying source systems are different.
From Ontology to Outcomes
The quality ontology is infrastructure. What it enables is a fundamental shift in how pharmaceutical quality operates.
The quality ontology is not a product feature. It is the architectural foundation that determines whether AI agents can reason about pharmaceutical quality — or whether they remain chatbots that search documents and fill in templates.
With a signalled ontology, an agent can:
- Detect a CQA trend and autonomously investigate the probable cause across every connected system in seconds
- Predict which batches are at risk of OOS before they fail, based on the compounding signals from material, equipment, and environmental factors
- Generate a CAPA recommendation based on what has actually worked for similar root causes across the entire manufacturing network — not based on generic templates
- Produce an APQR that tells the genuine quality story of a product’s year, with forward-looking recommendations grounded in signal trajectories
- Answer novel quality questions that no one anticipated when the system was designed, because the graph structure and signal layer support open-ended reasoning
Without the ontology, every one of these use cases requires months of custom data engineering, manual cross-system analysis, and static query development. With the ontology, they are skills that an agent can execute immediately — because the intelligence is pre-computed, the relationships are navigable, and the data lineage is complete.
The ontology is what separates pharmaceutical AI that demonstrates well in a conference presentation from pharmaceutical AI that operates at production scale across 50 sites. It is the infrastructure layer that most organisations don’t think about until they try to deploy their third agentic use case and discover that the first two were built on bespoke data pipelines that don’t generalise.
Build the ontology first. Everything else follows.
The quality ontology answers a question that has haunted pharmaceutical IT for two decades: how do you create a unified quality intelligence layer across MES, LIMS, QMS, and ERP without replacing any of them? The answer is a knowledge graph built by an AI agent, enriched with continuously computed signals, and reasoned over by the same agent. The systems of record stay where they are. The intelligence layer sits on top. And the agent navigates both.