Key Takeaways
Product quality prediction is not a machine learning problem — it is an architecture problem. The data required to predict quality risks lives across 8+ disconnected systems (MES, LIMS, ERP, stability, supplier quality, environmental monitoring). No single ML model can reason across fragmented data it cannot access.
Agentic AI — where specialised agents equipped with domain-specific skills and standardised tool interfaces autonomously traverse operational systems — is the architecture that makes continuous, predictive quality intelligence possible. Agents decompose complex assessments into skill-based workflows, delegate to sub-agents, and synthesise cross-system insights with full auditability.
The missing architectural layer is a quality ontology — a connected knowledge graph mapping products to critical quality attributes, process parameters, raw materials, and historical quality events. Without this ontology, even the most sophisticated analytics operate on incomplete, decontextualised data.
Organisations deploying agentic architectures for product quality prediction are detecting risks 10x faster than annual CPV cycles, consolidating 95% of quality-relevant data sources, and reducing batch write-offs by 40%. The architecture is deployed and measurable — not theoretical.
A process validation scientist at a multi-site manufacturer receives a routine alert: dissolution results for a tablet product have drifted 0.8% closer to the specification limit over the last six batches. The trend is not alarming — every result is within specification. But the scientist suspects a correlation with a recent change in excipient supplier. To confirm, she would need to correlate dissolution data from LIMS with material lot attributes from ERP, process parameter trends from MES, stability data from the stability database, and environmental conditions from the building management system. Each system has its own login, data model, export format, and retention policy. The investigation, if done manually, will take two weeks. By then, three more batches will have been manufactured with the same material lot.
This is the structural failure that defines product quality prediction in pharmaceutical manufacturing today. The data exists to predict quality risks before they materialise. The data is scattered across systems that were never designed to share it. And the tools the industry has deployed so far — dashboards, statistical models, annual CPV reports — are architecturally incapable of reasoning across the fragmented landscape where quality signals actually live.
This whitepaper argues that predictive product quality requires a fundamentally different architecture: a network of specialised AI agents, each equipped with domain-specific skills and standardised tool interfaces, operating on a unified quality ontology that connects products, processes, materials, and quality events across the manufacturing network. This agentic paradigm — where agents decompose complex quality assessments into composable workflows, delegate to specialised sub-agents, and synthesise cross-system intelligence with full regulatory auditability — delivers the continuous risk foresight that the industry has been promising but not delivering.
The data to predict your next quality failure already exists in your manufacturing systems. The problem is not intelligence — it is architecture. No single model, dashboard, or annual review can reason across eight disconnected systems in real time. Only a network of specialised agents, operating on a shared quality ontology with standardised tool access to every operational system, can deliver continuous predictive intelligence at enterprise scale.
The Cost of Reactive Quality
When quality risks are detected after the damage is done
Product quality in pharmaceutical manufacturing is assessed retrospectively. Continuous Process Verification (CPV) — the FDA’s expectation for lifecycle-based quality monitoring — remains, in practice, an annual retrospective exercise at most organisations. Quality teams compile historical batch data months after manufacturing occurred, perform statistical trending in spreadsheets disconnected from live process data, and deliver reports that are too late for effective intervention. A process drift that begins in January may not trigger a CAPA until the following year’s annual review.
The financial and operational consequences are quantifiable. Batch failure rates across the industry run at 5-10%, with each failure carrying direct costs (material write-offs, reprocessing, investigation labour) and indirect costs (supply disruption, customer complaints, regulatory exposure). FDA issued 105 warning letters for quality issues in FY2024 — the highest in five years — with inspection-based letters rising 21% from FY2023. Nearly half of senior pharma decision-makers report that data silos derail cross-functional collaboration, and Forrester estimates 73% of collected manufacturing data — environmental logs, equipment logs, machine data — sits unused in inaccessible formats. The quality signals are there. They are invisible.
5-10%
Industry batch failure rate
Planned scrap, rework, and reprocessing remain the norm — each failure triggering investigation, hold times, and potential supply disruption
105
FDA warning letters for quality (FY2024)
The highest in five years, with inspection-based letters rising 21% from FY2023 — reactive quality management draws increasing regulatory scrutiny
73%
Collected manufacturing data unused
Environmental monitoring logs, equipment logs, and machine data sit in inaccessible formats on standalone systems (Forrester) — invisible to quality assessment
Why Dashboards and ML Models Cannot Solve This
Four structural barriers that defeat traditional approaches to quality prediction
The industry’s first response to the quality prediction challenge has followed two paths: business intelligence dashboards that visualise quality metrics, and machine learning models trained on historical batch data. Both approaches have delivered incremental value. Neither can deliver the continuous, cross-system, predictive intelligence that the problem demands. The barriers are architectural, not computational.
Quality data is fragmented across 8+ systems with no shared schema
Product quality signals live in MES (batch yields, process parameters), LIMS (analytical results, stability data), ERP (material attributes, supplier lots), QMS (deviations, CAPAs), environmental monitoring (temperature, humidity, particulate counts), and complaint systems. Each stores data in its own format, granularity, and time resolution. A dashboard can visualise data from one system. It cannot reason across eight systems whose data models were never designed to interoperate.
Product robustness is multi-dimensional, not a single metric
A product's quality risk profile is the composite of process capability indices (Cpk/Ppk) across multiple CQAs, raw material variability sensitivity, historical deviation frequency, stability trends, equipment performance, and environmental exposure. Calculating a meaningful robustness score requires correlating variables across every system listed above — something a standalone ML model trained on batch records alone cannot do, because it lacks access to the material, equipment, and environmental context.
ML models require connected, curated data they rarely receive
Machine learning for quality prediction requires large, clean, multi-dimensional datasets where input features (process parameters, material attributes, environmental conditions) are correctly linked to outcomes (CQA results, deviation events, stability failures). In practice, these linkages do not exist in most pharmaceutical data environments. The data is siloed, inconsistently structured, and lacks the referential integrity needed for meaningful model training. Models trained on partial data produce partial predictions.
Annual CPV architecture cannot support real-time risk signals
The fundamental rhythm of quality assessment at most organisations is annual. CPV reports are compiled retrospectively, submitted for review months after the manufacturing events they describe, and rarely trigger immediate action. This cadence is not a process failure — it is a structural limitation of systems designed for periodic review rather than continuous monitoring. Predictive quality requires architecture that operates continuously, not tools layered onto an annual compliance cycle.
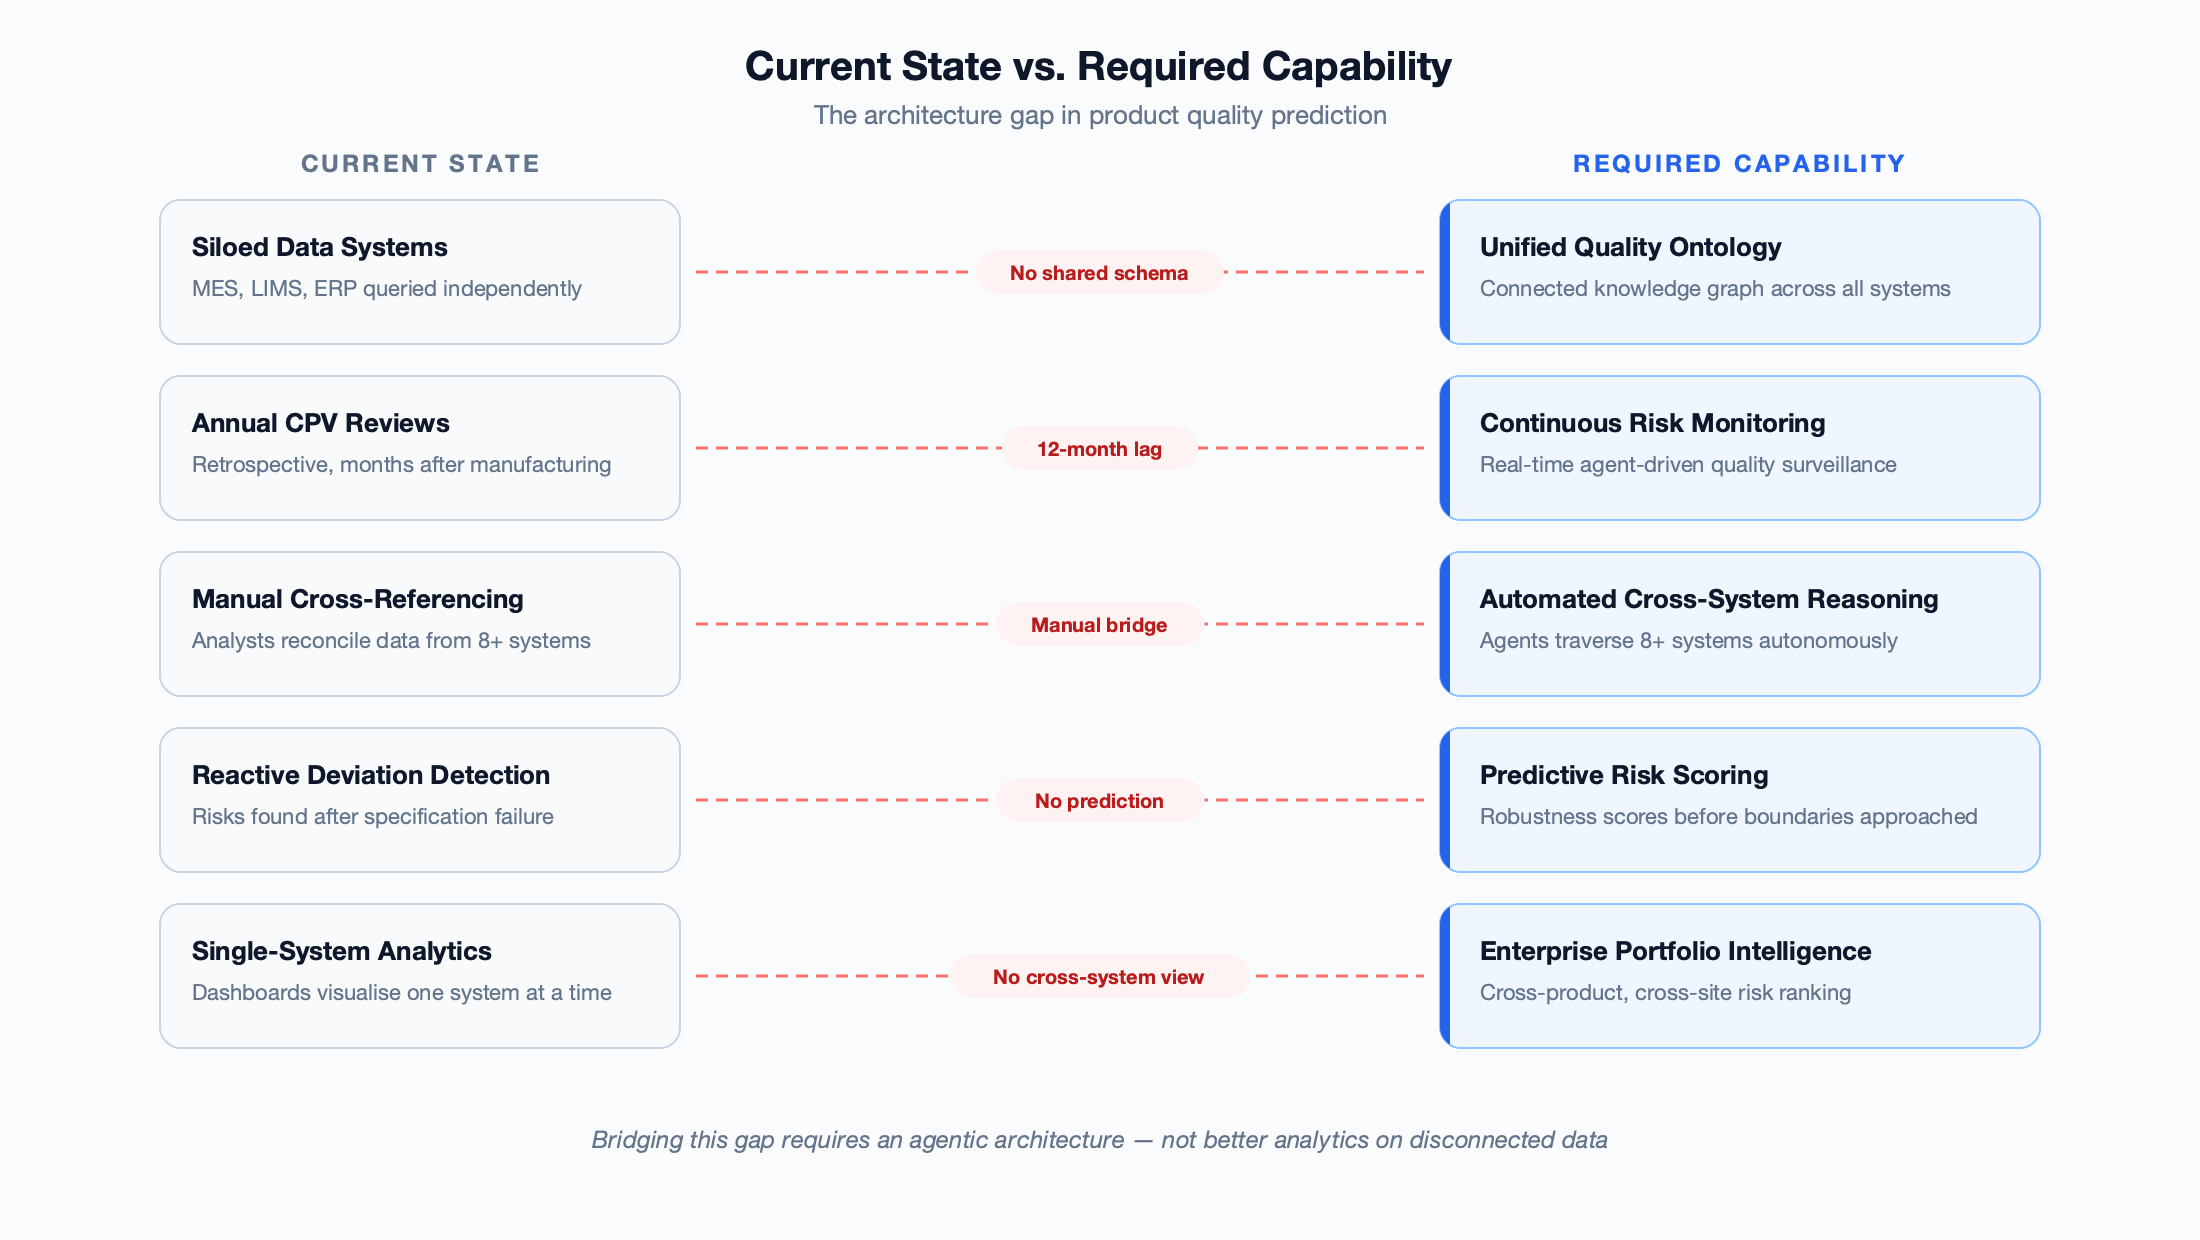
The bottleneck in product quality prediction is not the algorithm. It is the fact that the data required to predict quality risks is distributed across systems that no single tool — dashboard, ML model, or human analyst — can traverse in real time. Solving this requires an architecture designed for cross-system reasoning, not better analytics on top of disconnected data.
The Agentic Architecture for Quality Prediction
Agents, skills, sub-agents, and tool interfaces — the paradigm that makes cross-system quality intelligence possible
Agentic AI is an architectural paradigm where specialised software agents — autonomous, goal-directed programs equipped with domain-specific skills and tool interfaces — collaborate to accomplish complex tasks that no single agent or model could complete alone. Unlike a monolithic ML model that processes a fixed set of inputs, an agentic architecture decomposes complex goals into sub-tasks, assigns them to specialised agents, and orchestrates the results into a coherent output. Each agent operates within defined guardrails, accesses specific systems through standardised tool interfaces, and maintains a complete audit trail of every action and decision.
For product quality prediction, the agentic paradigm resolves the fundamental architecture gap: instead of building a single model that requires all data pre-integrated into one dataset, you deploy a network of agents that can autonomously traverse the systems where quality data lives — MES, LIMS, ERP, stability, supplier quality, environmental monitoring — reason across the results, and deliver continuous, contextualised risk intelligence.
Traditional analytics vs. ML-based prediction vs. agentic quality intelligence
| Dimension | BI Dashboard / CPV Report | ML-Based Prediction | Agentic Quality Intelligence |
|---|---|---|---|
| Data access | Single-system visualisation | Pre-integrated training dataset | Real-time access to 8+ systems via standardised tool interfaces |
| Analysis type | Retrospective, manual interpretation | Pattern recognition on historical data | Continuous, autonomous cross-system reasoning |
| Risk detection | After specification exceedance | When pattern matches historical failure | Before boundaries approached — predictive signals from correlated drift |
| Product coverage | One product, manually | Per-model (one model per product/CQA) | All products, all CQAs, continuously — agents scale across the portfolio |
| Material correlation | Not available | Only if material data was in training set | Automatic — ontology traces every material to every affected product and CQA |
| Time to insight | Months (annual CPV cycle) | Hours to days (after data preparation) | Continuous — agents monitor in real time and alert on threshold approaches |
| Cross-site intelligence | Site-by-site manual comparison | Separate models per site | Unified — same ontology and agents operate across all sites |
| Auditability | Report PDF with manual sign-off | Model version + training data snapshot | Every agent action, tool call, and reasoning step logged with ALCOA+ compliance |
How agents, skills, and sub-agents work together
The agentic architecture for quality prediction operates on five interlocking principles that distinguish it from traditional software and from standalone AI models:
1. Goal decomposition, not prompt-response. When a quality leader asks “what is the risk profile of Product X?”, the system does not generate a text response from a language model. The orchestrating agent decomposes the goal into a structured workflow: (a) retrieve the latest batch data from MES, (b) pull analytical results from LIMS, (c) check material lot attributes from ERP, (d) query stability trends, (e) scan deviation and CAPA history, (f) correlate environmental conditions during manufacturing, (g) compute statistical capability indices, (h) score product robustness, (i) compare against the portfolio. Each sub-task is assigned to a specialised agent with the skills and tool access required to complete it.
2. Skills are composable workflows, not prompts. Each agent possesses a library of skills — discrete, validated capabilities that define exactly what the agent can do, what data it needs, which systems it accesses, and what structured output it produces. A “Cpk/Ppk Trending” skill, for example, specifies the input schema (CQA identifier, time range, batch population), the tool calls required (query MES for in-process data, query LIMS for release results), the statistical methodology (process capability calculation per ICH Q10 guidelines), and the output schema (capability index, trend direction, confidence interval). Skills are composable: the Risk Scoring agent can invoke the Statistical Analysis agent’s “Cpk/Ppk Trending” skill as a sub-routine within its own “Robustness Quantification” workflow.
3. Sub-agent delegation for domain depth. When a task exceeds a single agent’s scope or requires specialised domain reasoning, agents delegate to sub-agents. The Risk Scoring agent, tasked with predicting dissolution failure risk for a product, may spawn a sub-agent specifically for multivariate correlation analysis — passing it the relevant process parameters, material attributes, and environmental conditions, and receiving back a structured correlation matrix with confidence scores. The sub-agent operates within the same audit trail, using the same tool interfaces, but brings focused analytical capability to a specific sub-problem. This delegation pattern — where parent agents orchestrate sub-agents that execute discrete analytical workflows — is what enables the system to handle the combinatorial complexity of multi-product, multi-CQA quality assessment without building a monolithic model.
4. Standardised tool interfaces for every operational system. Each enterprise system — MES, LIMS, ERP, stability database, supplier quality, environmental monitoring — is wrapped in a standardised tool interface that exposes its capabilities (read batch record, query analytical result, retrieve material lot attributes) as discoverable, authenticated, audit-trailed operations. Agents discover available tools at runtime, negotiate authentication through enterprise identity providers, and execute queries that generate structured audit records. Adding a new data source — an analytical platform like Databricks, a cloud data hub, a process historian — requires deploying one new tool interface, not rebuilding the agent architecture. Every existing agent immediately discovers and can utilise the new data source.
5. Quality ontology as the connective tissue. The agents operate on a shared quality ontology — a knowledge graph that maps the relationships between products, critical quality attributes (CQAs), critical process parameters (CPPs), raw materials, equipment, and historical quality events. This is the architectural layer that distinguishes agentic quality prediction from every other approach — and it warrants a closer examination.
The Quality Ontology: From Data Lake to Knowledge Graph
Why a unified data model — not a data warehouse — is the prerequisite for predictive quality
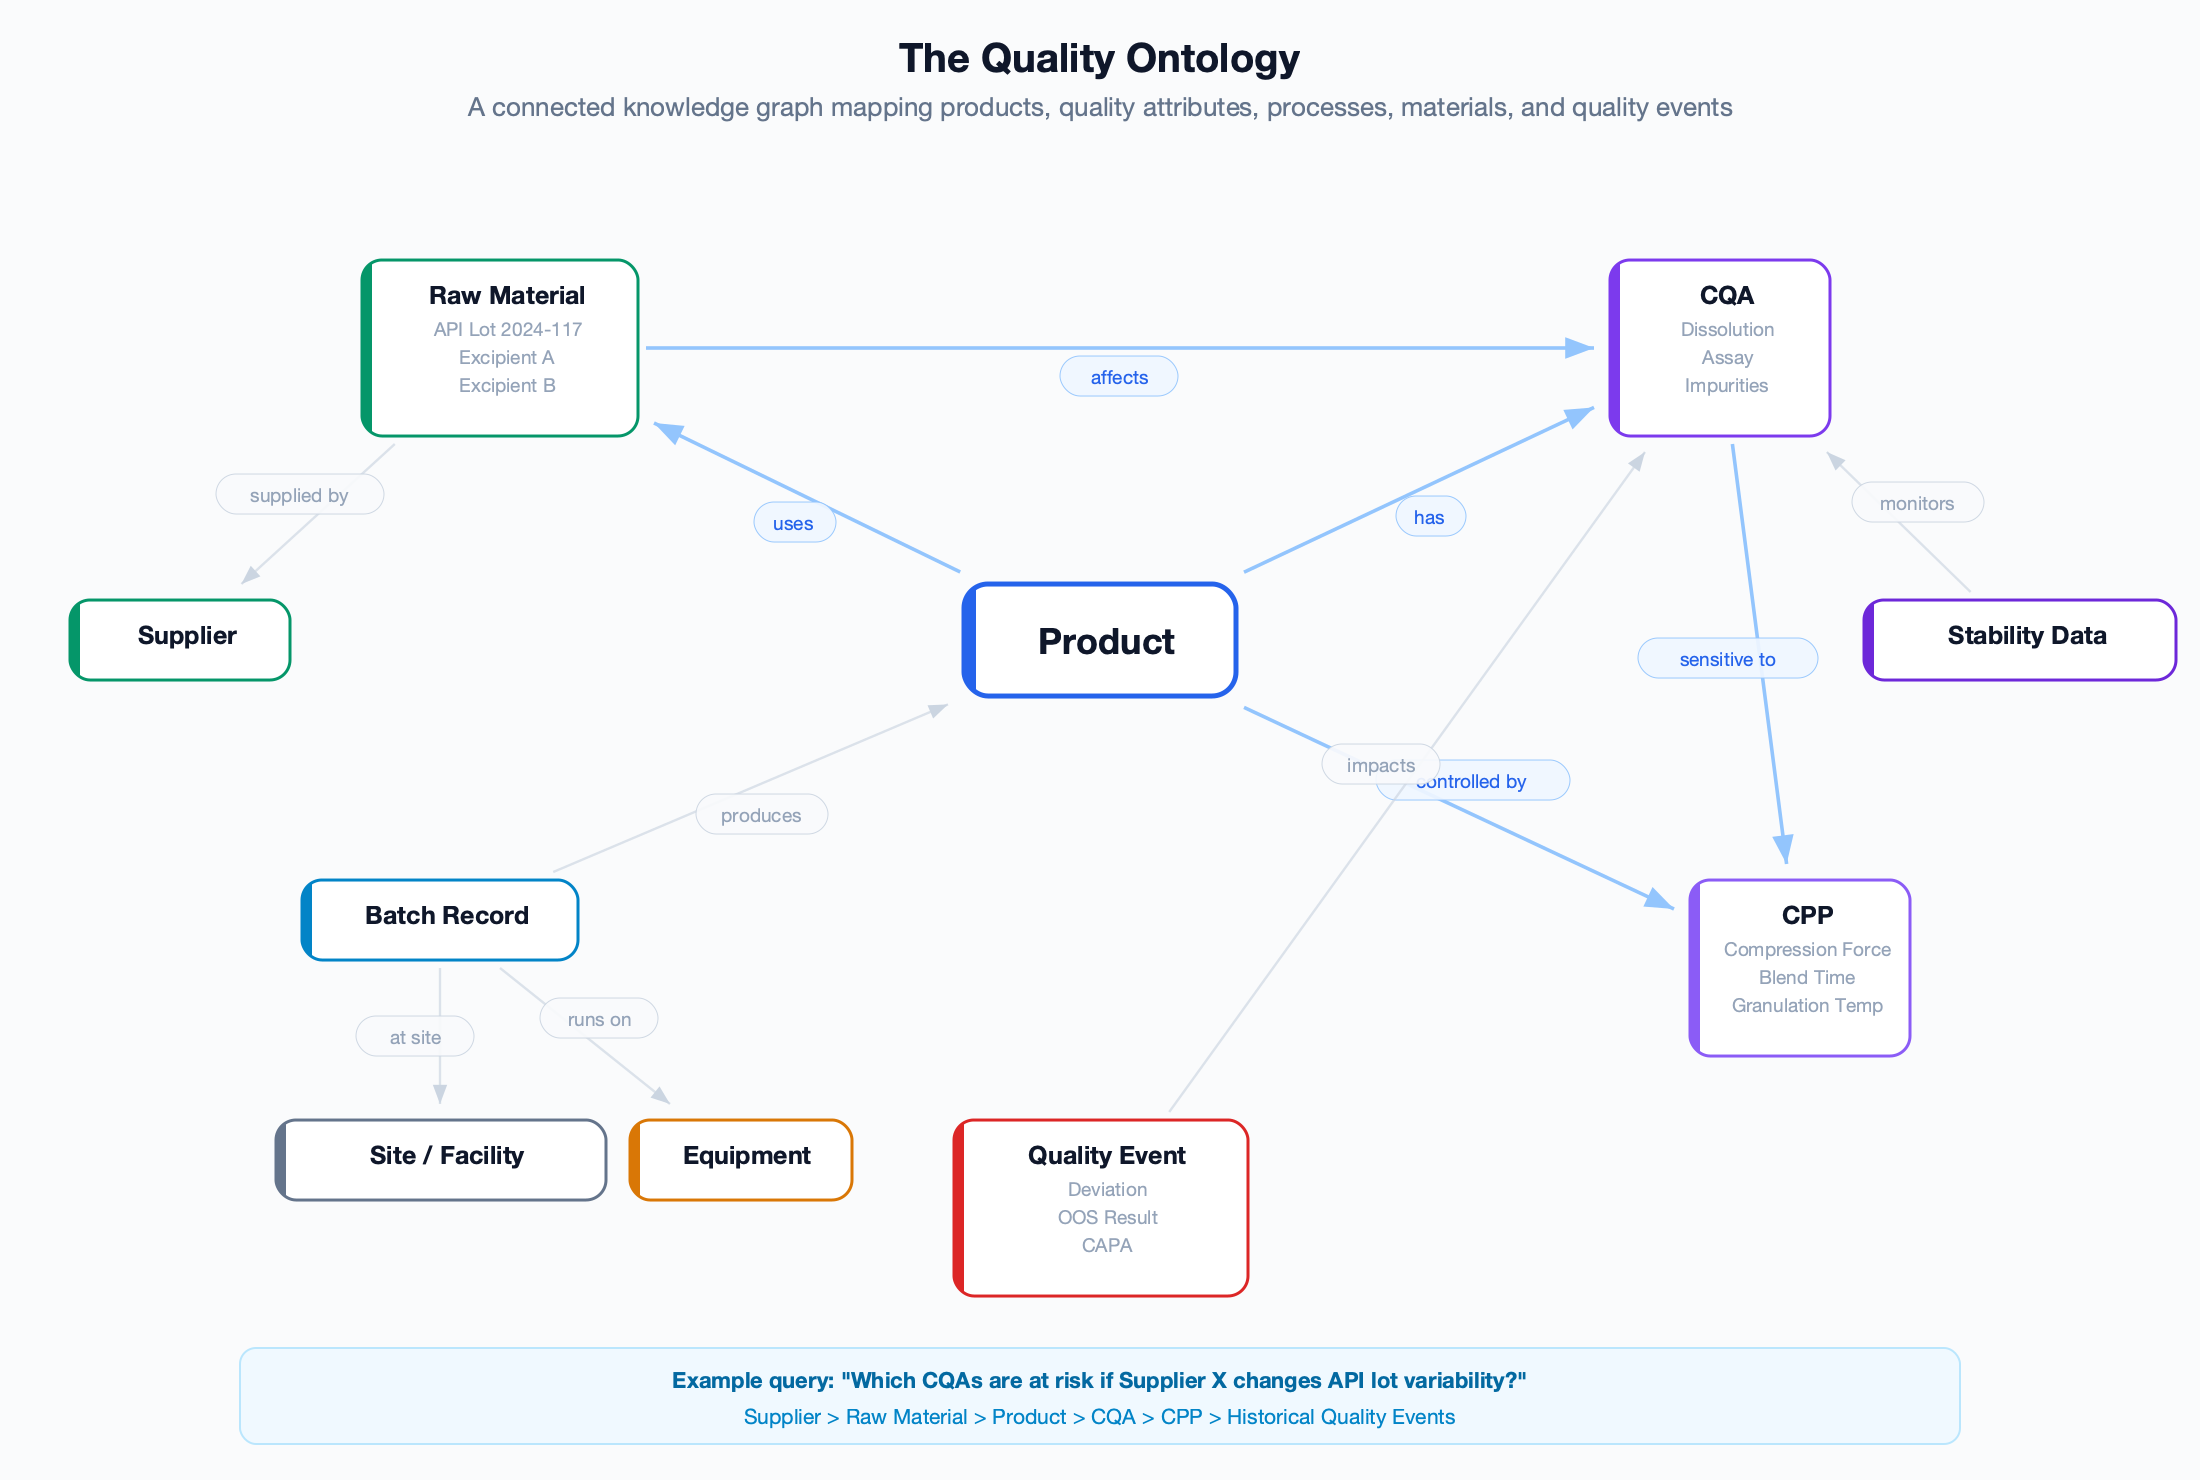
A data lake collects data. An ontology understands it. Most data integration initiatives in pharmaceutical manufacturing focus on aggregating data from multiple systems into a central repository — a data lake, a data hub, or a warehouse. This solves the access problem but not the reasoning problem. A data lake that contains batch records from MES, analytical results from LIMS, and material attributes from ERP has the data in one place, but it does not know that Product X uses Material Y, that Material Y’s lot variability affects CQA Z, or that CQA Z is sensitive to CPP W. Without these relationships, no amount of analytics can predict that a change in Material Y’s supplier will impact dissolution results for Product X three months from now.
The quality ontology is a connected knowledge graph — a formal model of every entity in your manufacturing operation and the named relationships between them. It is the foundation that makes cross-system reasoning possible, and the layer that every agent queries to contextualise its analysis.
What the ontology contains
The quality ontology models ten core entity types and the named relationships between them:
-
Product is the central entity. Every product has critical quality attributes, is controlled by critical process parameters, and uses specific raw materials. This three-way connection — product-CQA-CPP-material — is the foundation for predicting how a change in any input variable propagates to quality outcomes.
-
CQA (Critical Quality Attribute) — measurable properties like dissolution rate, assay, and impurity levels. Each CQA is sensitive to specific CPPs and affected by raw material variability. This sensitivity mapping is what transforms a statistical trend into a causal hypothesis: “dissolution is drifting because Blend Time variability increased after the equipment changeover.”
-
Quality Events (deviations, OOS results, CAPAs) are linked to the specific CQAs they impact, the batch records they were raised against, and the root causes identified during investigation. Over time, this creates a historical evidence base that agents mine for predictive patterns.
-
Suppliers and Raw Materials form the upstream chain. When a material lot attribute drifts, the ontology traces which products and CQAs are exposed — across every site that uses that material.
The ontology is not a static schema designed once during implementation. It is continuously enriched by the Data Integration agent as new batch records, analytical results, and quality events flow through the system — building a progressively richer model of how your manufacturing operation actually behaves.
A data lake stores your quality data in one place. An ontology understands how that data connects — which materials affect which products, which process parameters control which quality attributes, and which historical patterns predict future failures. The ontology is what turns data aggregation into quality intelligence.
The Five Specialised Agents
Each agent has a distinct domain, a defined set of skills, and access to specific tool interfaces
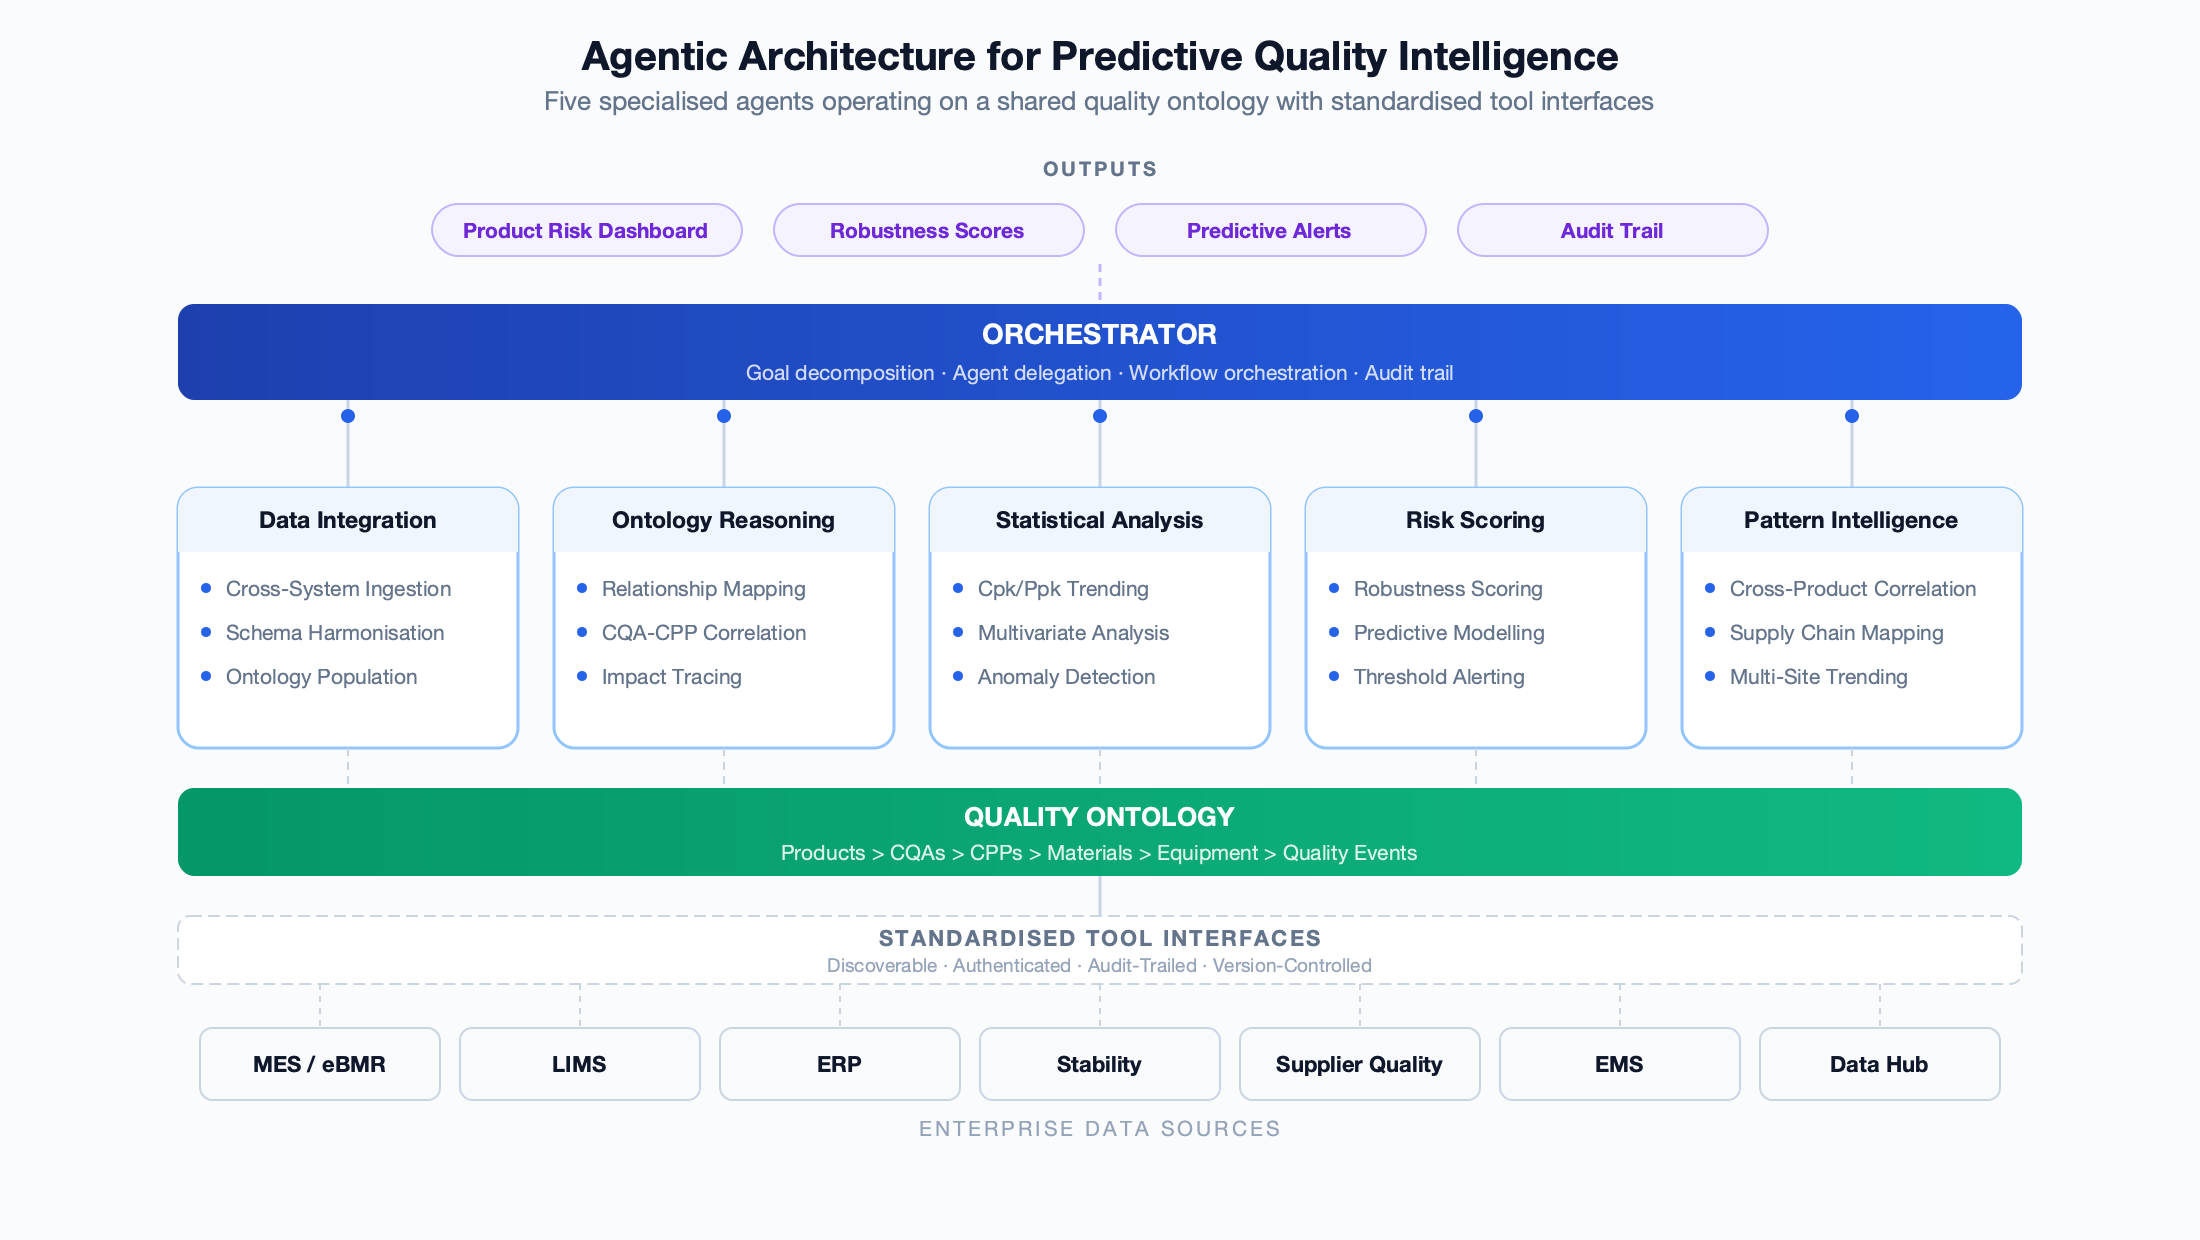
The architecture decomposes quality prediction into five agent domains. Each agent is autonomous within its scope, uses validated skills for execution, and delegates to sub-agents when a task requires deeper analytical specialisation. Together, they form a continuous quality intelligence pipeline — from raw data ingestion through to enterprise-level risk recommendations.
The diagram below shows how these agents fit within the full architecture stack — from enterprise data sources at the bottom, through standardised tool interfaces and the quality ontology, up to the orchestrator that coordinates agent workflows and delivers outputs.
Data Integration Agent
Connects to every operational system (MES, LIMS, ERP, stability, supplier quality, EMS) through standardised tool interfaces and continuously harmonises heterogeneous data — structured records, time-series sensor data, batch narratives, and supplier documents — into the quality ontology. Operates in real time, not batch mode: every new record, test result, and material receipt is integrated as it occurs. Sub-agents handle format-specific parsing (e.g., PDF extraction for supplier CoAs, HL7 mapping for LIMS feeds).
Ontology Reasoning Agent
Maintains and queries the quality knowledge graph — the connected model mapping every product to its CQAs, CPPs, raw materials, equipment, and quality event history. When a material lot is flagged, this agent traverses the ontology to identify every affected product, sensitive CQA, and correlated historical batch. Provides the contextual intelligence that transforms isolated data points into connected risk signals. Without this agent, all other agents operate on decontextualised data.
Statistical Analysis Agent
Performs continuous statistical analysis across every product in the portfolio — Cpk/Ppk trending, multivariate analysis, control chart generation, and anomaly detection. Receives contextualised data from the Ontology Reasoning agent, so a capability drift in dissolution is automatically correlated with material lot changes, equipment parameters, and environmental conditions. Maintains running models for every CQA of every product, spawning sub-agents for computationally intensive tasks like multivariate correlation.
Risk Scoring Agent
Aggregates signals from all other agents to compute a continuously updated robustness score for each product — integrating process capability indices, material quality signals, deviation trends, stability data, and manufacturing variability into a composite risk indicator. When a score approaches a defined threshold, generates a predictive risk alert with specific mitigation recommendations identifying not just that a product is at risk, but why, and what action reduces the risk.
Pattern Intelligence Agent
Identifies risk patterns that span products, sites, and supply chains. When a supplier's material quality drifts, correlates the impact across every product using that material, at every site. When a process parameter shifts at one facility, checks whether the same drift exists elsewhere. Delivers enterprise-level intelligence: a single ranked view of which products face the highest quality risk, which shared factors drive that risk, and which mitigation actions have the highest cross-portfolio impact.
Integration Architecture and Enterprise Requirements
How the agentic paradigm satisfies data hub compatibility, authentication, auditability, and role-based access
Enterprise deployment of agentic quality intelligence requires more than analytical capability. Organisations evaluating solutions must verify that the architecture integrates with existing data infrastructure (data hubs, analytical platforms, data lakes), supports enterprise authentication mechanisms, provides role-based access control, and generates audit trails that satisfy 21 CFR Part 11 and equivalent international regulations.
The agentic architecture addresses these requirements structurally — not as add-on features, but as inherent properties of the tool interface and orchestration layers.
Data hub and platform integration
Custom connectors for each system, each use case — O(systems × use cases) integrations to build and maintain
6-12 months per system
One tool interface per system — any agent can discover and use it. Adding a data hub or analytical platform requires one new interface
2-4 weeks per system
Authentication and security
Each integration manages its own credentials — service accounts, API keys, and tokens proliferate across connections
Manual credential management
Tool interfaces authenticate through the organisation's identity provider (SSO, OAuth 2.0, SAML). Agents inherit role-based permissions — no direct credential access
Centralised, auditable
Auditability and traceability
Analysts manually document their cross-system investigation. Audit trail is a narrative report, not a machine-readable log
Post-hoc documentation
Every agent action — tool call, data retrieval, reasoning step, sub-agent delegation — generates a structured, timestamped, ALCOA+ compliant audit record automatically
Real-time, by design
Role-based access control
Access controlled per system — a user with LIMS access may not have MES access, creating blind spots in quality assessment
Fragmented permissions
The platform enforces role-based access at the agent and tool level. QA Managers see risk alerts; Data Scientists drill into statistical models; auditors review full decision trails
Unified, configurable
Multi-product standardisation
Analytics configured separately per product — no standard framework for comparing risk across the portfolio
Weeks per product
Quality ontology provides a standardised schema for product-CQA-CPP-material relationships. New products register in the ontology and are immediately covered by all agents
Hours per product
The Experience in Practice
What it looks like when a quality leader queries the system
Architecture diagrams and capability comparisons describe what the system does. They do not convey how it feels to use it. The demo below illustrates a realistic interaction: a VP Quality queries the platform about a product’s risk profile, and the system’s agents collaborate across eight enterprise systems to deliver cross-portfolio intelligence — the kind of investigation that previously required two weeks of manual cross-referencing, completed in seconds.
Two things to notice: the system does not just answer the question — it identifies the correlated root cause (an excipient lot change) and recommends specific actions. When the follow-up question asks about cross-portfolio impact, the Ontology Reasoning agent traverses the knowledge graph to show every affected product, without the user needing to know which systems hold that data.
Quality Intelligence
Product Quality & Risk Assessment
Quality Risk Assessment Demo
See how specialised agents query MES, LIMS, ERP, and stability systems to build a real-time product risk profile — then trace cross-portfolio impact through the quality ontology.
Proactive monitoring: the application agents build for you
The chat interface above shows a reactive workflow — a quality leader asks a question and agents investigate. But the more powerful capability is proactive monitoring: agents that continuously compute risk scores, detect emerging signals, and assemble an actionable dashboard before a human knows to ask.
The following demonstrates the full application experience. Watch as agents populate a product portfolio with computed risk scores, then follow a quality leader as they click into a flagged product, drill into a dissolution signal, review the agent-generated root cause analysis and cross-portfolio impact table, and initiate an investigation — all within an application where every card, score, and suggested action was assembled by agents operating autonomously across eight connected systems.
Quality Risk Dashboard
Portfolio monitoring — assembled by 5 agents
Product Portfolio
12 products monitored · 847 CQAs tracked · 3 sites
Metformin 500mg
7.2/ 10
Metformin 1000mg
8.4/ 10
Glimepiride 2mg
9.1/ 10
Atorvastatin 20mg
8.8/ 10
Proactive Risk Monitoring
See how agents assemble a real-time quality dashboard, detect signals across sites, and recommend actions — then watch a user investigate a risk through to resolution.
Deployment Evidence
Measurable outcomes from organisations operating agentic quality architectures
The agentic architecture for product quality prediction is not theoretical. Organisations that have deployed AI agent platforms with cross-system integration, quality ontologies, and continuous monitoring are demonstrating quantifiable improvements across every dimension of quality performance.
These results come from multi-site pharmaceutical deployments operating under FDA, MHRA, and EMA oversight — environments where every prediction, every risk score, and every mitigation recommendation must be defensible under regulatory inspection.
10x
Faster risk detection
Continuous agent-driven monitoring versus annual retrospective CPV reviews — risks identified in days rather than months
95%
Data source consolidation
Quality-relevant data unified into a single ontology-backed model, up from 30-40% coverage in manual cross-referencing processes
40%
Reduction in batch write-offs
Early risk signal detection and material-quality correlation enabling preventive action before specification exceedance
Deployment evidence across quality prediction dimensions
| Dimension | Before (Manual / Annual CPV) | After (Agentic Architecture) | Improvement |
|---|---|---|---|
| Risk detection latency | 6-18 months (annual CPV cycle) | Continuous (real-time alerts) | 10x faster |
| Data sources integrated | 2-3 systems manually cross-referenced | 8+ systems continuously synchronised | 95% coverage |
| Batch review cycle | 20 days manual review | 1 day automated pre-screening | 95% reduction |
| Right First Time rate | Industry baseline | +12 percentage points | Absolute improvement |
| Manual data entries | 100% manual transcription between systems | 40% (automated integration) | 60% reduction |
| Regulatory jurisdictions | Site-specific, uncoordinated | FDA, MHRA, EMA on single platform | 3 jurisdictions unified |
| Cross-product risk visibility | Manual, quarterly at best | Continuous portfolio risk ranking | Full portfolio coverage |
Evaluation Framework: Three Capabilities That Define Readiness
What to assess when evaluating platforms for predictive quality intelligence
Organisations evaluating agentic quality intelligence platforms should assess three foundational capabilities that determine whether a solution can deliver on the promise of continuous, predictive, enterprise-scale quality risk management. These capabilities are architectural prerequisites — without any one of them, the system reverts to the same limitations as dashboards and standalone models.
Cross-System Data Integration with Quality Ontology
The platform must connect to all quality-relevant systems — MES, LIMS, ERP, stability, supplier quality, environmental monitoring — through standardised, validated interfaces. Critically, it must maintain a quality ontology that maps relationships between products, CQAs, CPPs, materials, and equipment. Without the ontology, data integration is just data aggregation. Evaluate: does the platform know that a change in Material X affects CQA Y for Products A, B, and C? Or does it merely store data from multiple sources in one location?
Autonomous Agent Workflows with Skill-Based Execution
The platform must support specialised agents that decompose quality assessment goals into structured workflows, execute validated analytical skills (statistical analysis, risk scoring, pattern detection), and delegate to sub-agents for domain-specific depth. Evaluate: can the system autonomously investigate a quality signal — correlating process data with material attributes and environmental conditions — without a human manually querying each system? Are skills validated and version-controlled? Is every agent action audit-trailed?
Enterprise Security, RBAC, and Regulatory Compliance
The platform must integrate with enterprise identity providers, enforce role-based access at the agent and tool interface level, and generate 21 CFR Part 11 compliant audit trails for every prediction, risk score, and recommendation. Evaluate: can you show an auditor exactly how a risk score was calculated — which data was retrieved, from which systems, through which agents, using which statistical methods? Is every step attributable, timestamped, and tamper-evident?
The organisations that will predict and prevent quality failures are not the ones with the most sophisticated machine learning models. They are the ones that built the integration architecture first — standardised tool interfaces to every operational system, a quality ontology that connects products to processes to materials to quality events, and an agent framework that can reason across all of it continuously, autonomously, and with full regulatory traceability.
The FDA’s FY2024 quality report documented a 21% increase in inspection-based warning letters. ICH Q10 and FDA process validation guidance increasingly expect lifecycle-based quality management — not annual retrospective reviews, but continuous monitoring with proactive risk signals. The regulatory trajectory is unambiguous: organisations that cannot demonstrate predictive quality capability will face escalating enforcement exposure.
For VP Quality and CIO leaders evaluating their quality architecture, the strategic question is no longer whether to move beyond annual CPV. It is whether the architecture you choose can traverse your fragmented data landscape, reason across the relationships that drive quality risk, and do so continuously, autonomously, and with the auditability that satisfying regulators demands. The agentic paradigm — agents with skills and tool interfaces operating on a shared quality ontology — is deployed, measurable, and setting the standard that the industry will spend years trying to replicate.